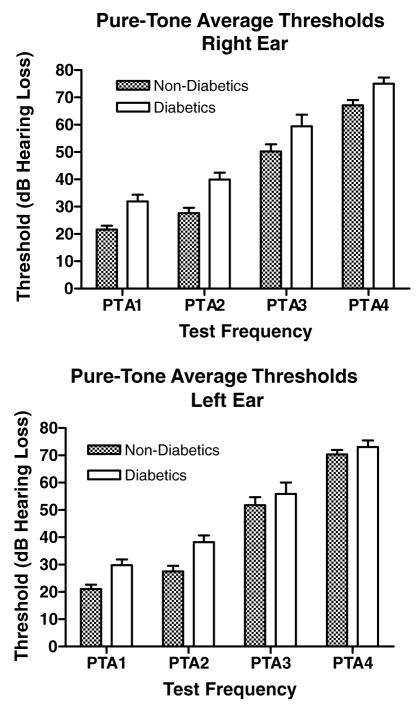
Fig. 1.
For all frequencies tested, diabetics had higher tone thresholds than non-diabetic controls. Note that differences were greater at low frequencies, and were greater for the right ear compared to the left. See Table 1 for PTA frequency ranges. Right ear main effect: p < 0.0001, F = 30.8, df = 1; right ear post-hoc for PTA1: p < 0.05, t = 2.88; PTA2: p < 0.01, t = 3.44; PTA3: p < 0.05, t = 2.57, df = 1. Left ear main effect: p < 0.001, F = 13.8, df = 1; left ear post-hoc for PTA2: p < 0.05, t = 3.03, df = 1. Error bars are SEM.

