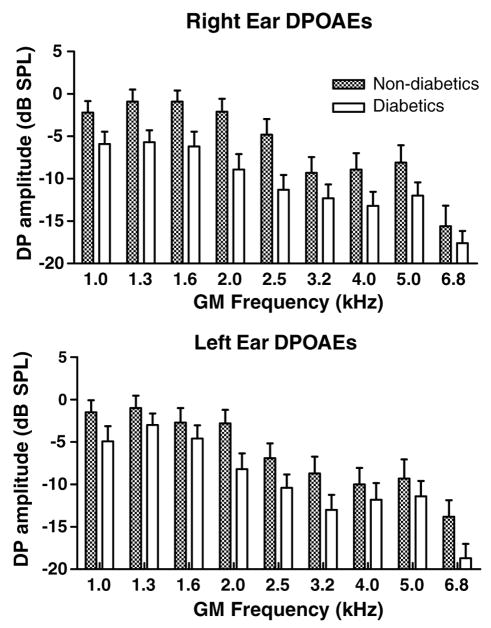
Fig. 3.
At all frequencies, DPOAEs were smaller for diabetics relative to non-diabetics. Like the threshold measures presented in the previous figures, the right ear was more affected than the left. ANOVA showed significant main effects of subject group (right: p < 0.0001, F = 31.1, df = 1; left: p < 0.0001, F = 15.2, df = 1). Interactions and subject group Bonferroni post-hocs were not significant, except for the right ear at 2 kHz: p < 0.05, t = 2.82, df = 1. GM = geometric mean of f1 and f2. Error bars are SEM.

