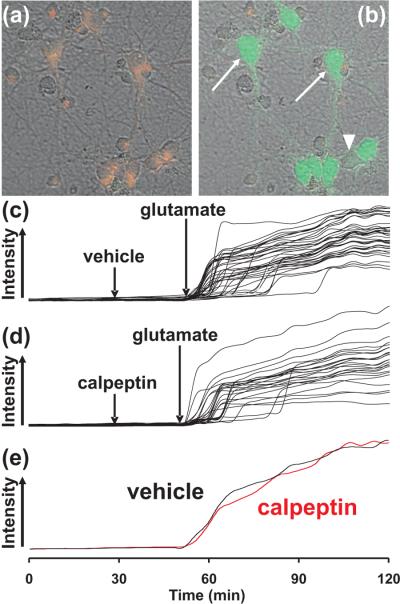
Fig 2. The effect of calpeptin on DCD in neurons imaged with Fluo-4FF.
Neurons loaded with the membrane potential sensitive dye TMRM+ (red) and the calcium indicator Fluo-4FF (green) are depicted before (a) and 16 minutes after (b) treatment with 100 μM glutamate. Arrows identify examples of cells with intense Fluo-4FF fluorescence that underwent calcium deregulation while the arrowhead denotes a cell that did not yet exhibit DCD although it depolarized in response to glutamate. In (c-d), Fluo-4FF responses in individual cells from representative fields of neurons are plotted over time in the absence (c) and presence (d) of 10 μM calpeptin. (e) shows the average [Ca2+]c response from each field of cells.

