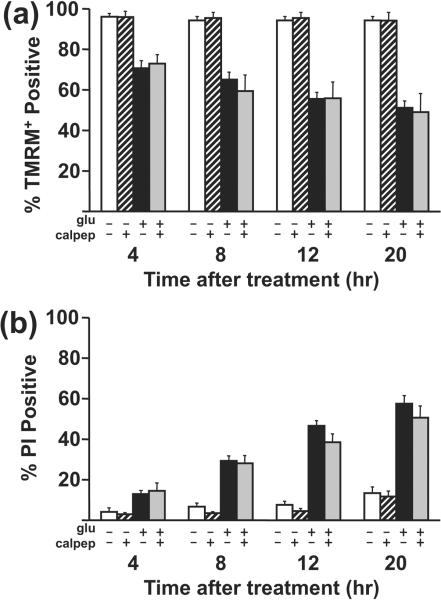
Fig. 6. Effect of calpeptin on cell death following a 30 min glutamate challenge.
Cortical neurons received a 30 min 100 μM glutamate or mock challenge with or without a 30 min calpeptin pre-treatment (white bars, control, hatched bars, calpeptin, black bars, glutamate, gray bars, glutamate + calpeptin). The glutamate challenge was ended by the addition of 10 μM MK801 + 10 μM NBQX. Cell viability and death over time were monitored by TMRM+ and propidium iodide fluorescence, respectively, and quantified at 4, 8, 12, and 20 hrs after the end of the glutamate challenge. For TMRM+ data, mean ± SE is from n=4 wells for control ± calpeptin and from n=6 wells for glutamate ± calpeptin, both from 4 independent cultures. For PI data, mean ± SE is from n=10 wells for control ± calpeptin and from n=12 wells for glutamate ± calpeptin, both from 7 independent cultures. Glutamate and calpeptin were present throughout.

