Fig. 4.
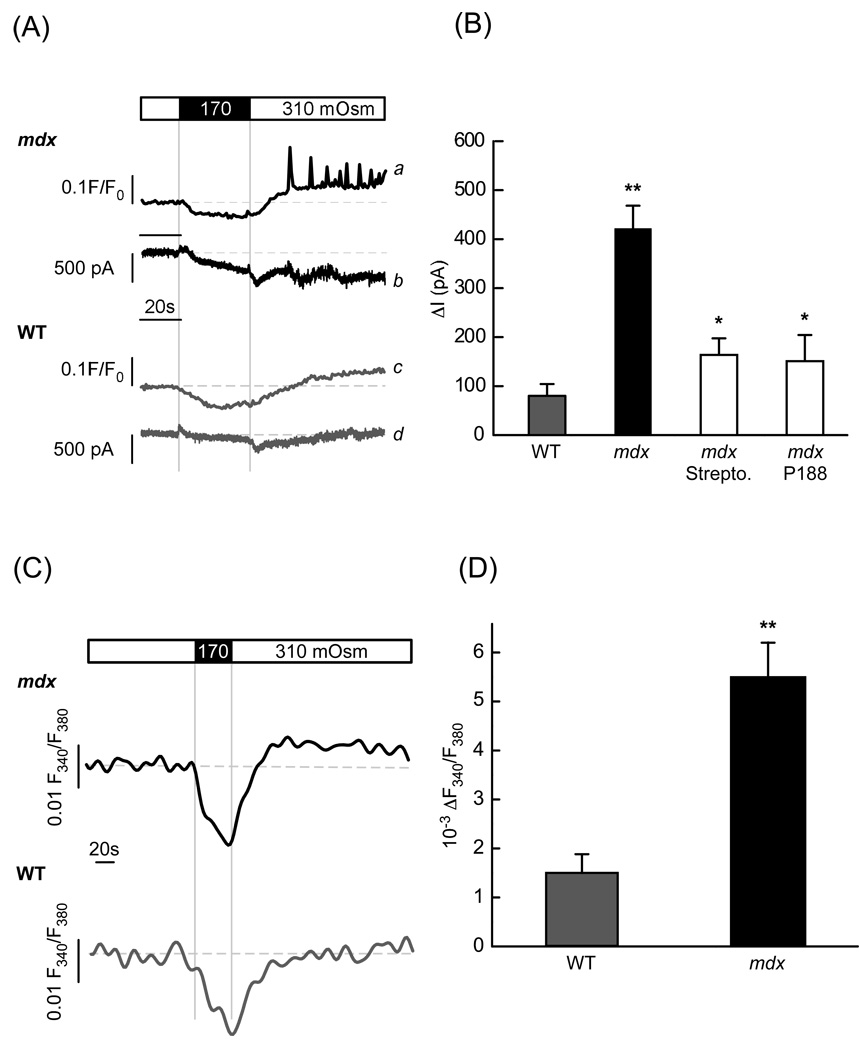
Stress-induced membrane currents and ion influxes. (A) Representative intracellular Ca2+ signals and ionic currents produced by stress in mdx (traces a and b) and WT (traces c and d) cardiac myocytes held at −70 mV. (B) Average increase of stress-induced inward currents in mdx and WT myocytes under control conditions (no inhibitors added) and in mdx cells treated with 100 µM streptomycin or 150 µM P-188 (n= 15, 18, 18, 11 for WT, mdx, P-188 and streptomycin, respectively). (C) Changes of intracellular Na+ concentration elicited by osmotic swelling in mdx and in WT myocytes. (D) Relative changes in [Na+]i in the WT and mdx cells determined at the end of the recording (between 110 s and 140 s after stress was applied, n=16 and 18, respectively).

