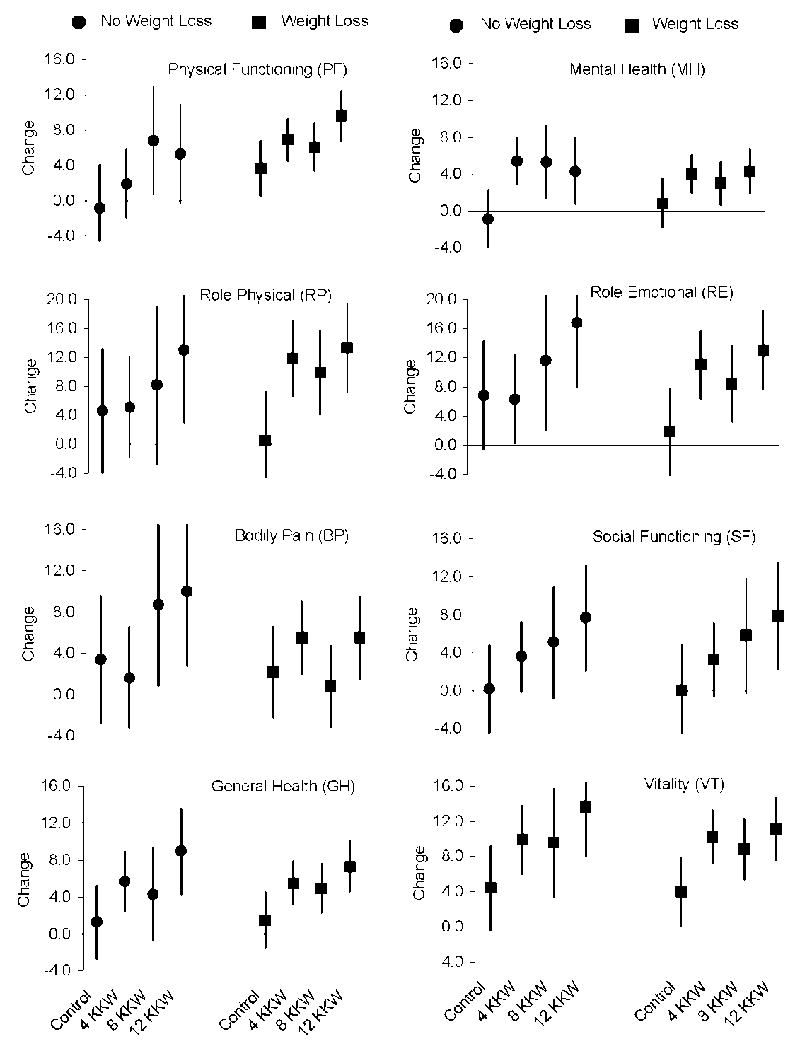
Figure 4.

Change in SF-36 scores across the exercise groups was examined for two subgroups of participants: 1) those who lost weight vs. 2) those who maintained or gained weight, using analysis of covariance (ANCOVA) with baseline age, antidepressant use, employment status, ethnicity, marital status, and smoking status as covariates. Mean change (Least-squares means ± 95% confidence interval) on SF-36 scales across the control and exercise groups for participants who did and did not lose weight are depicted. The results from the ANCOVAs follow: PF, F(3, 416) = 0.12, p=0.95; RP, F(3, 416) = 1.00, p=0.39; BP, F(3, 416) = 1.41, p=0.24; GH, F(3, 416) = 0.28, p=0.84; MH (3, 416) = 0.18, p=0.91; RE, F(3, 416) = 2.41, p=0.07; SF, F(3, 416) = 0.87, p=0.46; and VT, F(3, 416) = 0.11, p=0.95. These non-significant interactions indicate that the pattern of change in each of the SF-36 measures across the exercise groups was similar for those who did and did not lose weight.
