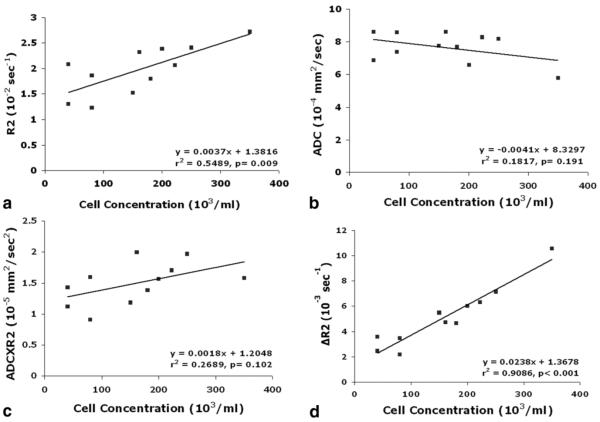
FIG. 6.
Graphs showing the relationships between R2 (a), ADC (b), ADC×R2 (c), ΔR2 (d), and labeled cell concentration in vivo. ADC (b) and ADC×R2 (c) did not exhibit significant correlation with labeled cell concentration while R2 (a) showed a moderate correlation. However, ΔR2 (d) showed significant correlation with labeled cell concentration after correcting background variation.

