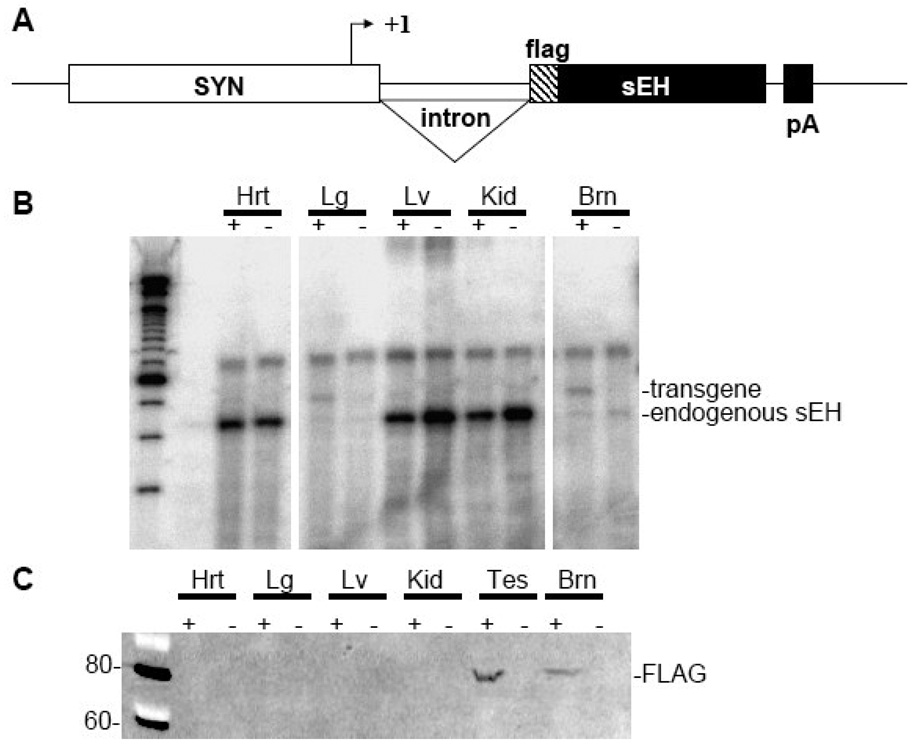
Figure 7. Development of neuronal sEH expressing transgenic mice.
A. Transgene map. B. RNase protection assay showing expression of endogenous and transgenic sEH as indicated. C. Western blot showing flag-tagged sEH protein in tissue extracts. Key: + vs − indicates the presence of the transgene. Hrt, heart; Lg, lung; Lv, liver; Kid, kidney; Brn, brain; Tes, testes.

