
Figure 1.
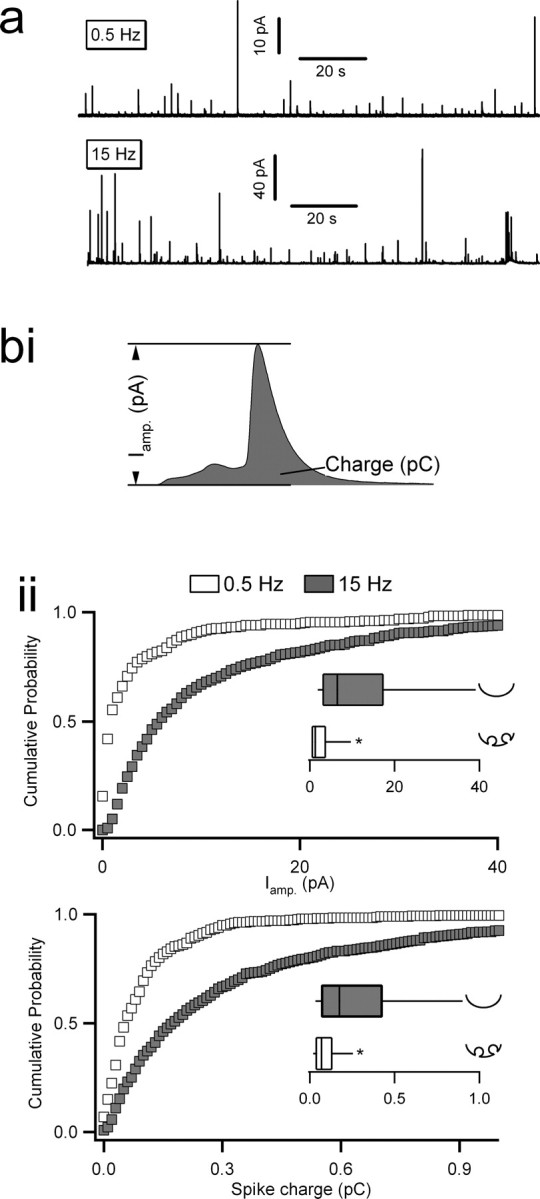
Amperometric analysis of catecholamine release under 0.5 versus 15 Hz electrical stimulation. Chromaffin cells were held at −80 mV in the perforated-patch configuration and stimulated with action potential equivalent waveforms. a, Representative traces from cells continuously stimulated with action potential equivalent voltage templates at 0.5 or 15 Hz are provided (note the difference in scale). Equivalent time windows are shown for better comparison. Individual spikes were identified using an automated detection algorithm and then manually confirmed. bi, Two kinetic parameters, maximum spike amplitude (in picoamperes) and total spike charge (in picocoulombs), were measured for each individual spike. bii, Pooled cumulative probability plots for spike amplitude (top) and charge (bottom) are provided. Insets show box-and-whisker plots for their respective datasets. Parameters for the box-and-whisker plots are as follows: smallest nonoutlier, first quartile, median, third quartile, and largest nonoutlier observation. Statistical significance for medians was determined by a Mann–Whitney nonparametric median analysis, and asterisks in each box-and-whisker plot indicate statistical significance (p < 0.001). Icons next to each box-and-whisker category provide interpretation of the mode of fusion. n = 12 cells from 7 preparations for 0.5 and 10 cells from 7 preparations for 15 Hz.