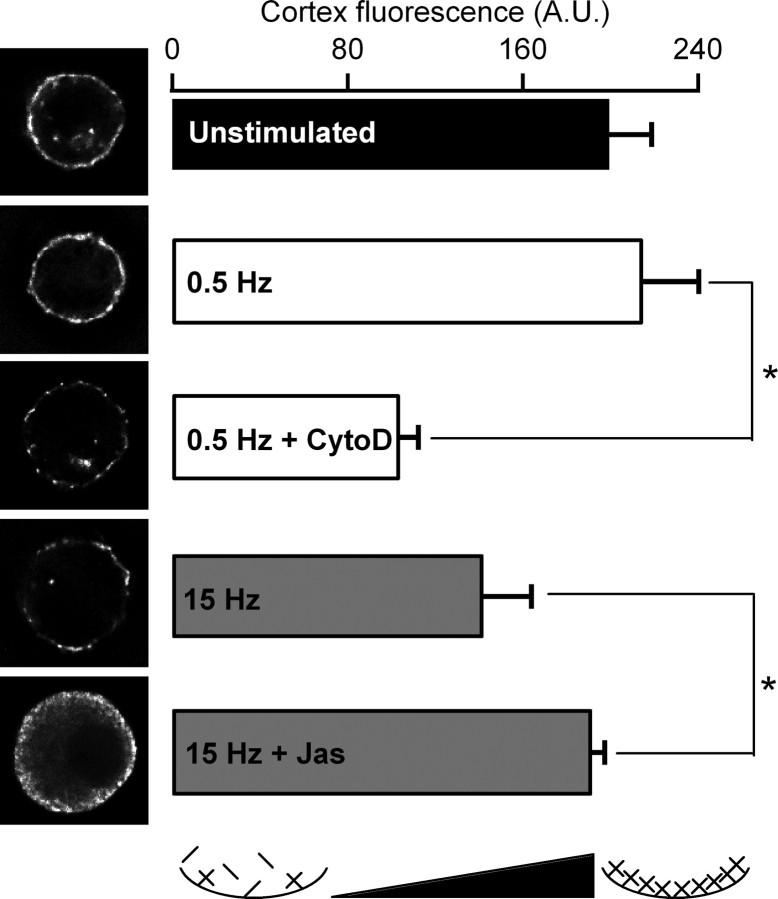
Figure 2.
Rhodamine–phalloidin imaging of the actin cortex. Chromaffin cells were stimulated as in Figure 1, but immediately fixed after stimulation by perfusion with a paraformaldehyde-containing Ringer's solution. After fixation, cells were permeabilized by Triton X-100 perfusion and stained with rhodamine-conjugated phalloidin to provide a fluorescence-based index of filamentous actin. Each cell was imaged as a stack with 0.25 μm z-steps. All cells in the dataset were imaged with identical illumination, exposure, and camera gain settings to enable quantitative cross-comparison of intensity levels. Equatorial images of representative cells for each condition are provided (left column), and quantified mean cortical staining (cell periphery and 1 μm under periphery) is provided in the bar-graph format (right column). Abbreviations CytoD and Jas represent cells treated with cytochalasin D and jasplakinolide, respectively, in this and other figures. An icon at the bottom of the right column represents the status of the cortical actin as a function of fluorescence intensity. n = 15 cells from 3 preparations for all conditions. Statistical significance for each mean parameter was determined by Student's t test, and an asterisk in each category indicates statistical significance with respect to control (p < 0.05). Error bars represent SEM.

