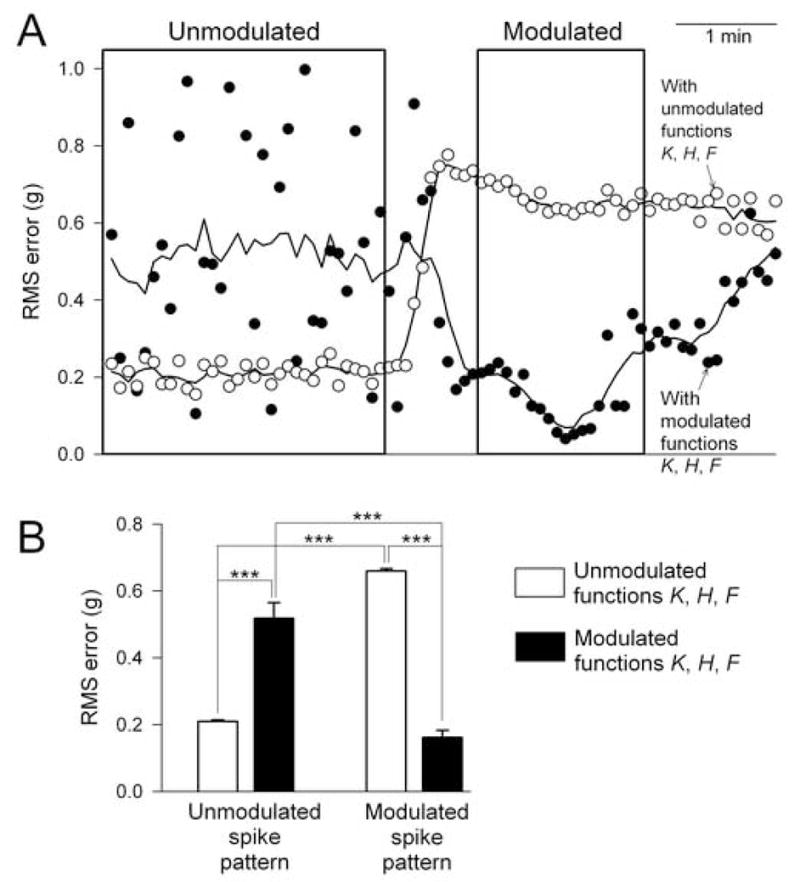
Fig. 5.

Statistics of the reconstruction of the entire dataset. A: root mean square (RMS) error between the real contraction waveform Rexp and the reconstructed contraction waveform Rest when a reconstruction like that in Fig. 4 was performed for each successive 5 s-long segment of the data in Fig. 2A with either the unmodulated (open points) or the modulated (filled points) functions K, H, and F. The continuous curves are simply smoothed curves through the points to show their average trend. The boxes are reproduced from Fig. 2A to indicate the portions of the data from which the unmodulated and modulated functions K, H, and F were decoded. B: means ± SE of the RMS errors from A, comparing four conditions: unmodulated spike pattern segments reconstructed with the unmodulated functions K, H, and F (bar 1) and with the modulated functions (bar 2), and modulated spike pattern segments reconstructed with the unmodulated functions (bar 3) and with the modulated functions (bar 4). Specifically, the points included in the appropriate bars of B were all those lying within the boxes in A. Statistical significance was tested with ANOVA on ranks followed by pairwise multiple comparisons using the Holm-Sidak method; “***” indicates p < 0.001.
