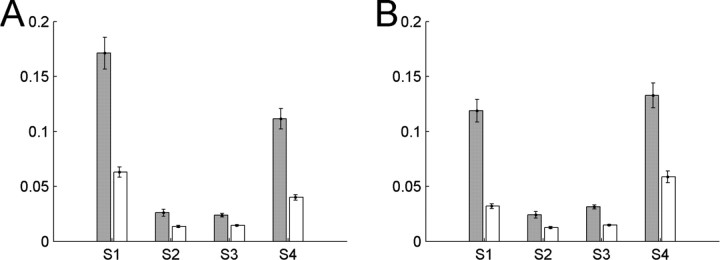
Figure 8.
Mean mutual information (over trials) for each subject between the phases φ1(t, f1) and φ2(t, f2) (white bars) in the premotor region during movement and mean mutual information between the phase in the motor region, φ(t, f1 + f2), and the sum of the phases in the premotor region (gray), φ1(t, f1) + φ2(t, f2), during movement. The error bars indicate the SEM. A shows the mutual information for the results from the initial analysis, and B, for the post hoc results.

