
Figure 4.
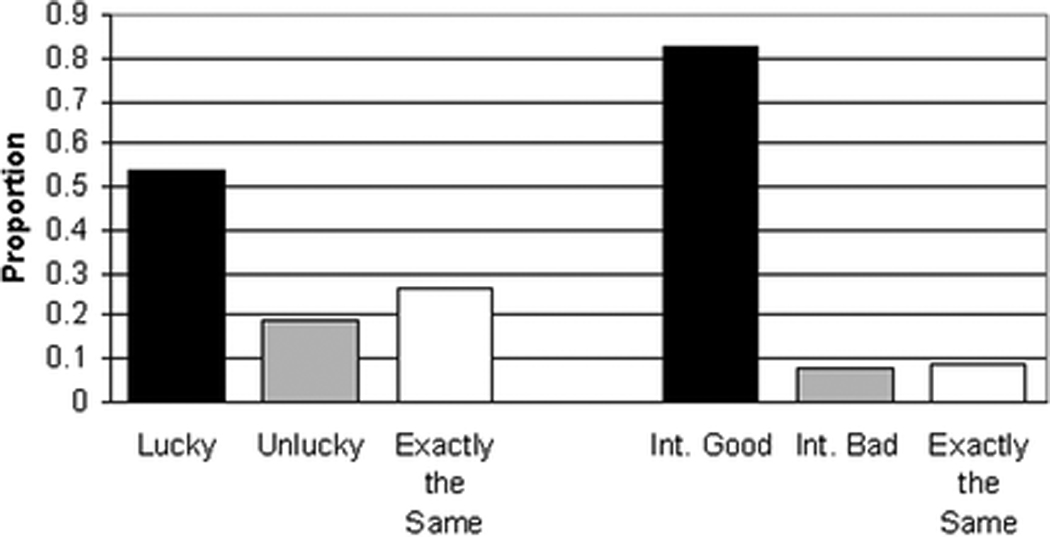
Mean proportion of times in Study 5 that each actor was selected as the “nicer” one across 6 lucky vs. unlucky items and across 6 intentional good vs. intentional bad items in which the option “exactly the same” was also given.
Official websites use .gov
A
.gov website belongs to an official
government organization in the United States.
Secure .gov websites use HTTPS
A lock (
) or https:// means you've safely
connected to the .gov website. Share sensitive
information only on official, secure websites.
Mean proportion of times in Study 5 that each actor was selected as the “nicer” one across 6 lucky vs. unlucky items and across 6 intentional good vs. intentional bad items in which the option “exactly the same” was also given.