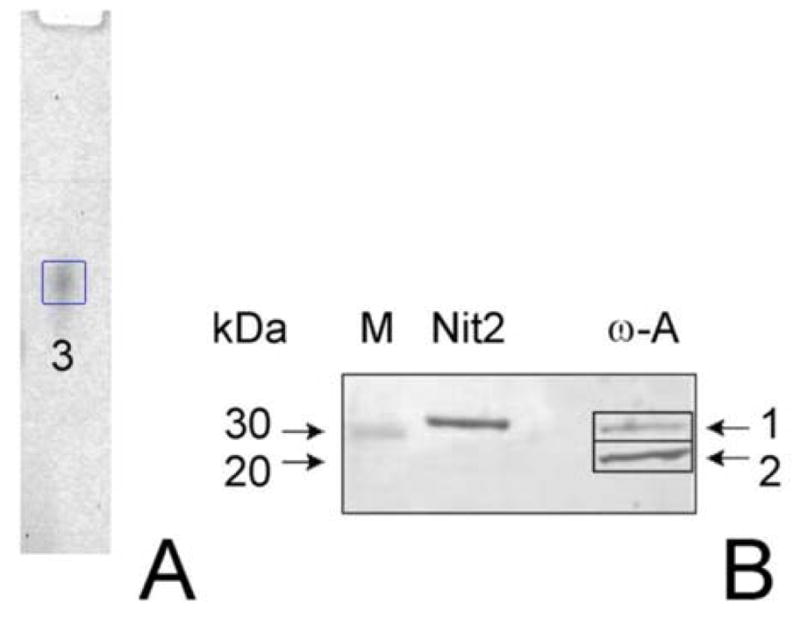
Fig. 1. Analysis of rat liver ω-amidases by gel electrophoresis.

A) Electrophoresis of purified rat cytosolic rat liver ω-amidase on a native gel. B) SDS-PAGE. Lanes are labeled as follows: M, Mr markers; Nit2, purified human ω-amidase/Nit2; ω-A, purified cytosolic rat liver ω-amidase. Equal amounts of protein (1.0 μg) were applied to the native gel and to lanes labeled Nit2 and ω-A in the SDS-PAGE gel. Blank lanes contained an equal volume of the sample buffer lacking enzyme. Protein bands were visualized by silver staining.
