
Figure 4.
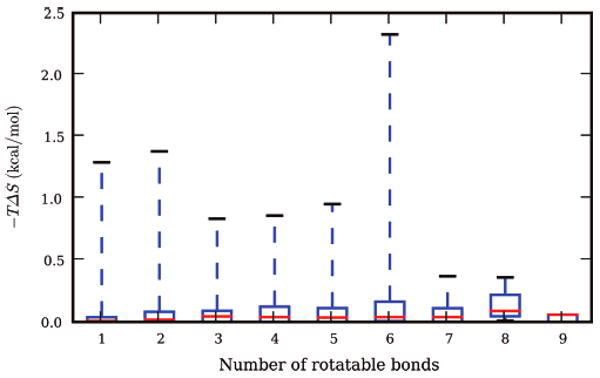
Number of rotatable bonds versus –TΔS of solvation. Shown is a box plot of the number of rotatable bonds versus –TΔS of solvation. The red line shows the median; the box shows the bounds of the upper and lower quartiles, and the dashed lines show the full range of –TΔS. The correlation between –TΔS and the number of rotatable bonds is only R2 = 0.03, and there are 17 small molecules with –TΔS larger than 0.5 kcal/mol.