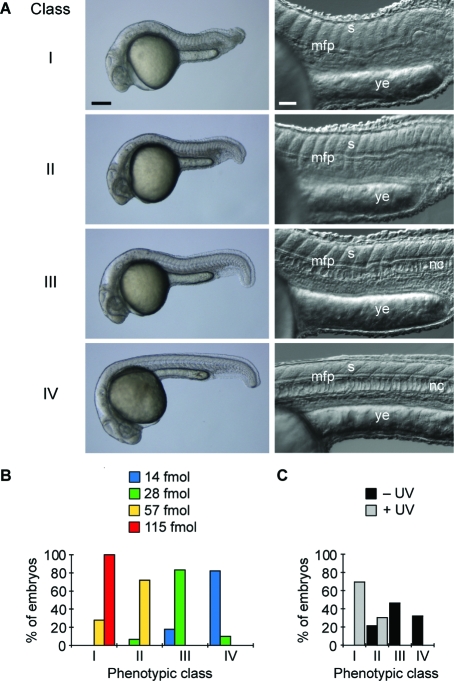
Figure 3.
Conventional and caged MOs targeting the ntla gene and classification of ntla mutant phenotypes. (A) Classification of ntla mutant phenotypes according to morphological cues. Somitic (s), medial floor plate (mfp), notochord (nc), and yolk extension (ye) tissues are labeled. Scale bars: left panels, 200 μm; right panels, 50 μm. Bright-field (left) and differential interference contrast (right) images of 1 dpf embryos are shown. (B) Distribution of phenotypes according to the dose (per embryo) of a conventional ntla MO. (C) Distribution of phenotypes for ntla cMO 8a at a dose of 115 fmol/embryo with and without photoactivation.

