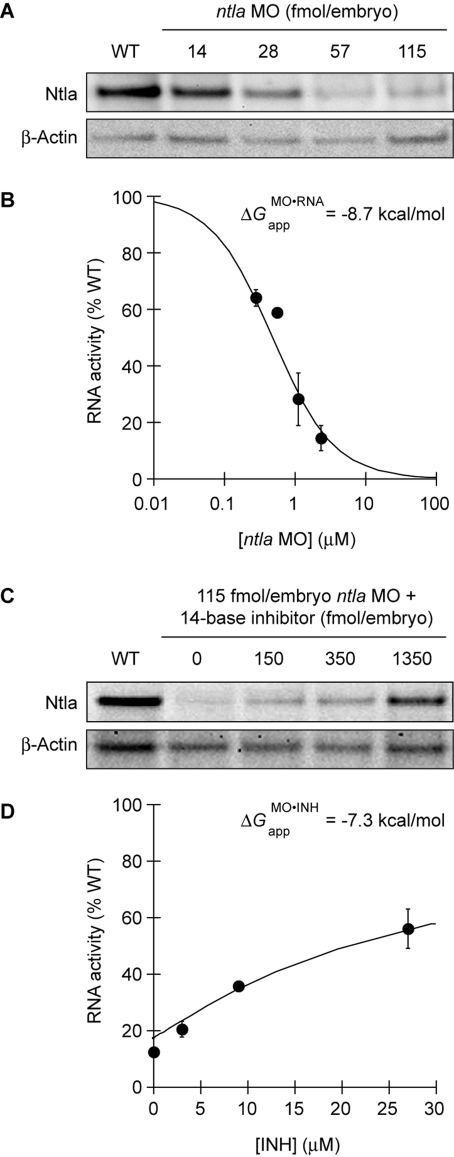
Figure 7.
ntla MO/RNA and ntla MO/inhibitor interactions in vivo. (A) Ntla protein knockdown in zebrafish embryos injected at the one-cell stage with various ntla MO doses. Ntla and β-actin levels at 10 hpf were detected by immunoblotting and quantified. (B) These data can be modeled as a two-state equilibrium (solid line), yielding an apparent free energy value (ΔGMO·RNAapp = −8.7 kcal/mol) that describes MO/RNA interactions in live embryos. (C) Ntla protein knockdown in embryos injected at the one-cell stage with ntla MO (115 fmol/embryo) and various doses of the 14-base inhibitory oligomer corresponding to ntla cMO 8g. Ntla and β-actin levels at 10 hpf were detected by immunoblotting and quantified as above. (D) Modeling of the 8g data in (C) as a three-state, competitive equilibrium (solid line) yields an apparent free-energy value (ΔGMO·INHapp = −7.3 kcal/mol) that describes 8g MO/inhibitor interactions in vivo. The graphical data are means of triplicate samples with error bars representing the standard deviations.

