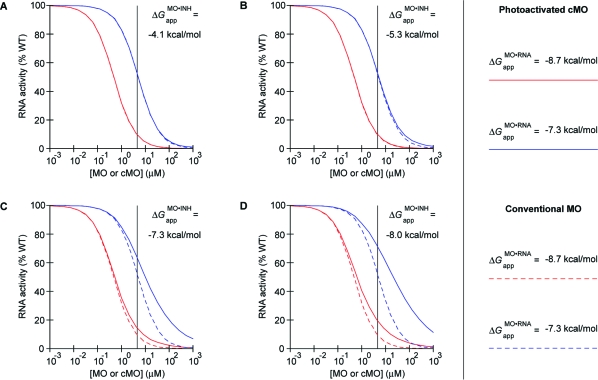
Figure 8.
Modeling of in vivo cMO activity. Photoactivated cMOs and MOs inhibit their RNA targets with different efficacies, which diverge as the MO/RNA interaction strength decreases. This divergent activity profile is exacerbated when the MO/inhibitor interaction strength increases. RNA activity curves for MOs and photoactivated cMOs associated with in vivo MO/RNA interaction energies of (red) −8.7 and (blue) −7.3 kcal/mol are shown for intermolecular MO/inhibitor interaction energies estimated for the “blunt” ntla cMOs (A) 8e, (B) 8f, (C) 8g, and (D) 8h, assuming complete uncaging upon irradiation. Actual photoactivation yields in vivo are likely 50−75% (see text). Photoactivated cMO and conventional MO activity profiles are drawn as solid and dashed colored lines, respectively. The embryonic ntla cMO concentration used in our structure−activity studies (see Figure 4) is indicated in each panel by the vertical black line.

