
Figure 3. Object Recognition Sample Trial.
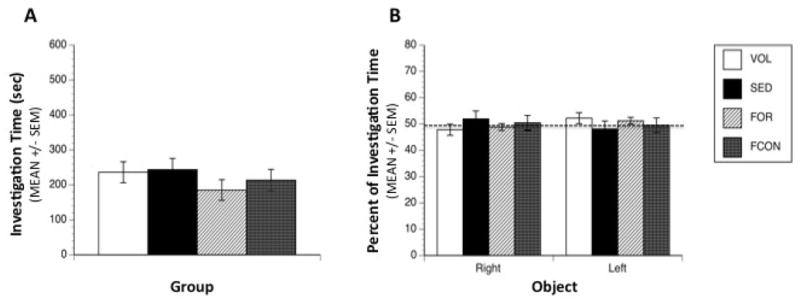
Object investigation during the sample trial. (A) No significant differences were observed between groups in total time spent investigating both objects, and all groups spent an average of 220 sec in active investigation of the objects during the 600 sec trial. (B) All groups spent an equal percentage of their investigation time on both copies of the object during the sample trial. Dashed line represents chance level of investigation.