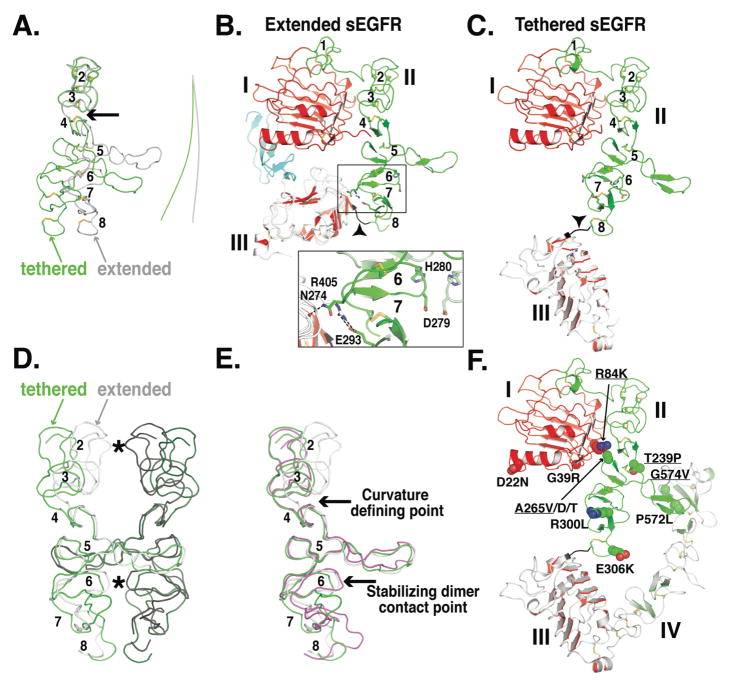
FIGURE 4. Conformational changes in domain II of sEGFR.
A. Smoothed backbone representations of domains II from extended (gray) and from tethered (green) sEGFR. The coordinates of domain I and the first three disulfide-bonded modules of domain II (amino acids 1-225) were used to superimpose the two structures. The lines to the right indicate the curvature of the long axis of domain II. Disulfide bonds are shown (A–C & F) and disulfide-bonded modules numbered (A–E, module 1 is not shown in A, D or E).
B. Cartoon of domains I, II and III from extended sEGFR (pdb id 1MOX) oriented as in A. The area of detailed (boxed) shows the domain II/III interactions that contribute to stabilizing module 6. See text for details.
C. Cartoon of domains I, II and III from tethered sEGFR (pdb id 1YY9), oriented as in A. Note the very different trajectory of the end of domain II (in black and marked with an arrowhead) compared to part B.
D. Domain II from the sEGFR501/TGFα dimer is shown with the left hand molecule in gray and the right hand molecule in black. Contact points across the dimer are indicated with asterisks. Using coordinates from disulfide-bonded module 5 only, domain II from tethered sEGFR has been superimposed first on the right hand extended domain II (green) and then on the left hand extended domain II (dark green) to create a model for a “dimer” of two domain II molecules in the tethered conformation.
E. Domain II from extended (gray) and from tethered (green) sEGFR and from sErbB2 (magenta) shown in same orientation as D. See text for details.
F. Cartoon of tethered sEGFR in the same orientation as C and with the positions of somatic mutations in glioblastoma shown in space filling representation. Those mutations that have been show to cause activation of EGFR are underlined.

