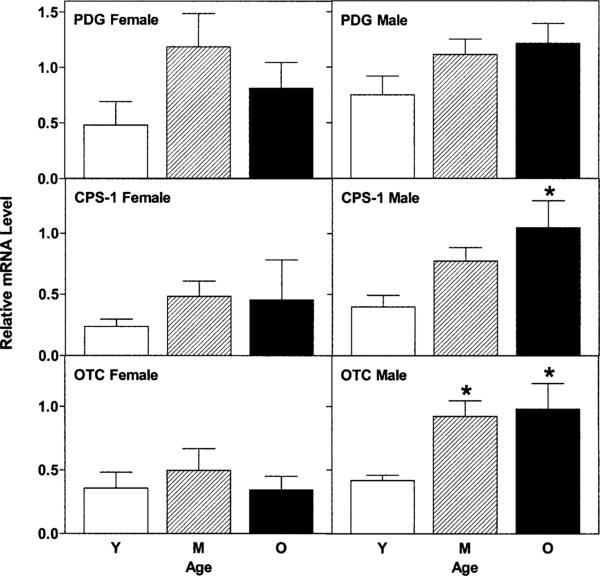
Fig. 2.
Relative levels of PDG, CPS-1, and OTC mRNAs in small intestine of female and male rats during aging. Relative mRNA levels were quantified as described in Section 2.2 and are displayed as averages ± S.E.M. Key to abbreviations and symbols: Y = young, M = middle-aged, O = old, * indicates significantly different (P < 0.05) from relative mRNA level in young rats.

