
Fig. 2.
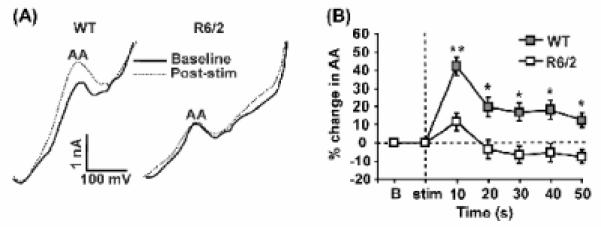
Striatal ascorbate (AA) release in response to cortical stimulation (stim). (A) Sample voltammograms obtained from a WT mouse and a R6/2 mouse. Baseline AA peak (solid line) represents a single scan taken immediately before stim. The post stim peak (dashed line) represents the first single scan taken 10 s after cortical stim of 10 s duration. The AA oxidation peak occurred between -100 and -200 mV versus reference. Note that the AA peak increases after cortical stim in the WT mouse but does not in the R6/2 mouse. (B) Mean percent change in striatal AA release across time. Baseline (b) represents the last baseline scan before stim. Dashed lines denote baseline on y-axis and stim on x-axis. Single scans at each time point were compared to baseline. (** p < 0.001, * p < 0.01) n = 23 sessions in 5 WT mice and 25 sessions in 5 R6/2 mice.