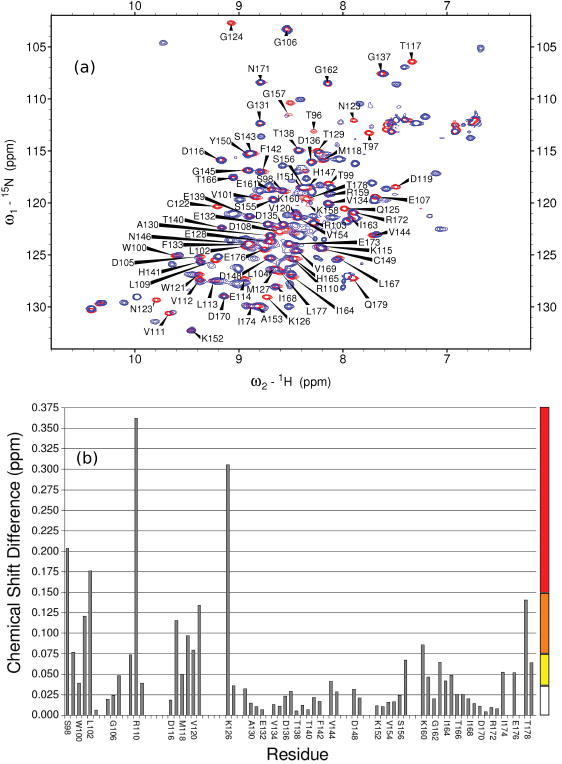
Figure 3. FAIM-CTD is perturbed by removal of the N-terminal domain.

(a) Overlaid 15N-HSQC spectra of isolated FAIM-CTD (red) and full-length triple mutant FAIM-S (blue). Assignments are of FAIM-CTD. Buffer pH is 6.9-7.1. The buffer of full-length FAIM-S has 3% Tween-20. Titration experiments (not shown) indicated that chemical shift perturbation of FAIM-CTD by 3% Tween-20 was minimal and does not explain the observed differences.
(b) Chemical shift differences in the 15N-HSQC spectra in (a) are calculated according to the formula , plotted as a function of residue, and used to color Figure 4b according to the scale at right. No value is shown for residues that could not be assigned in one or both spectra.
