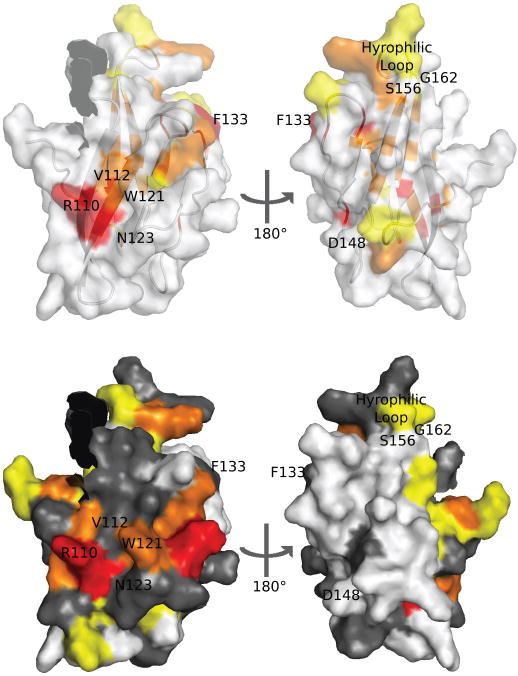
Figure 4. Structure and sequence analysis highlight residues of FAIM-CTD involved in interactions with FAIM-NTD and other entities.

Surface-exposed residues discussed in the text are labeled in this figure. The position of the non-native G148D mutation is shown. Nine residues preceding K95 are omitted.
(a) Superimposed surface and ribbon models of FAIM-CTD with conserved residues colored as in Figure 2d.
(b) Surface model of FAIM-CTD with residues colored according to chemical shift perturbation (see Figure 3b). Residues for which chemical shifts are not known in one or both constructs are shown in gray.
