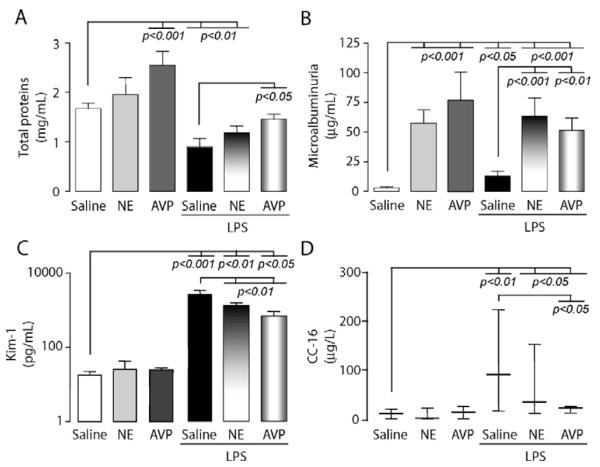
Figure 4.
Modulation of urinary biomarkers after endotoxin (lipopolysaccharide, LPS) challenge in the presence or absence of vasopressors (arginine vasopressin [AVP] and norepinephrine [NE]). The bar charts represent measurements in urine of A, total proteins; B, microalbumin; C, kidney injury molecule-1 (Kim-1) (log scale on y-axis) (mean ± SD); D, Clara cell protein (CC-16) (median, 25th—75th percentiles). Data are representative of total 18-hr urine from groups with similar bar assignment (n = 8), as described in Fig 2. The p values are indicative of significant difference(s) vs. control or vs. LPS.

