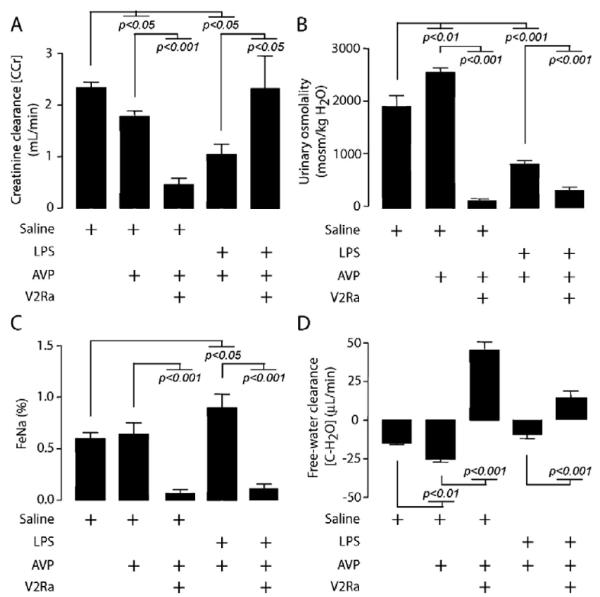
Figure 7.
Effect of V2R antagonist (V2Ra) SR-121463B on lipopolysaccharide (LPS)-induced renal dysfunction with or without arginine vasopressin (AVP) infusion. The bar charts represent analysis (mean ± SD) of A, creatinine clearance (CCr) established by the formula (UV/P × 1/1440 min); B, urine osmolality; C, fractional sodium excretion (FeNa+) established by the formula (C Na+/CCr); D, Electrolyte free-water clearance (CH2O) calculated by the formula (UV × (1 - [UrNa]) + [UrK]/[Na plasma]). Data are representative of trunk blood and total 18-hr urine from (left to right bar) control (saline), AVP and V2Ra (SR-121463B), LPS plus AVP, and LPS plus AVP and V2Ra (SR-121463B)-treated rats (n = 8). The p values are indicative of significant difference(s) vs. control or respective group without V2Ra.

