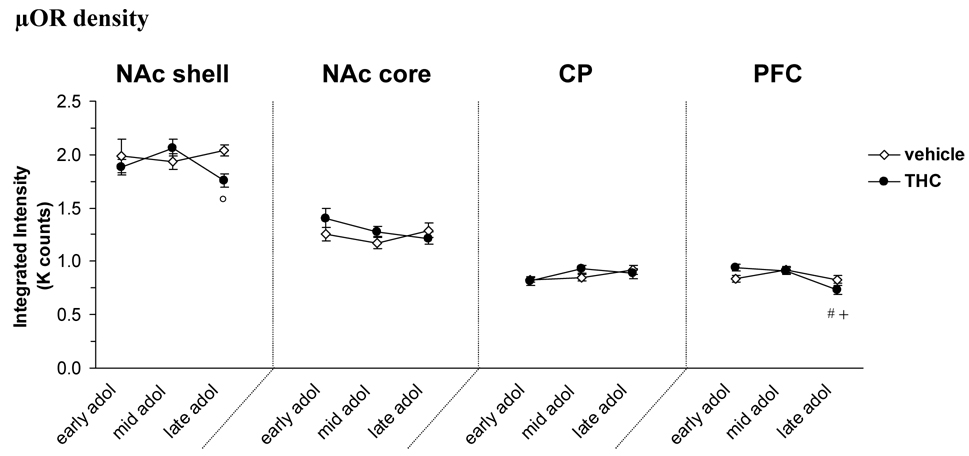
Figure 4.
Density of µOR at different developmental time points (early, mid and late) during adolescence and the effect of THC exposure. Data is shown as mean ± SEM. °, P<0.05 significant treatment effect THC vs. vehicle control. #, P<0.05 significantly different vs THC early adolescence. +, P<0.05 significantly different vs THC mid adolescence. (n=5). Abbreviations in figure 1.

