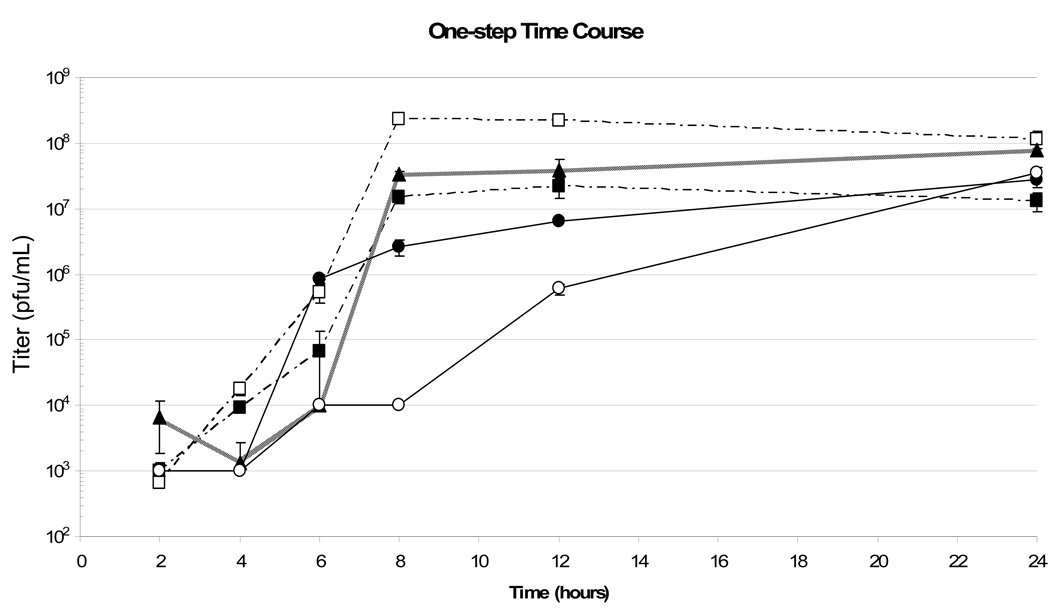
Figure 5. One-step growth curve.
A549 cells were infected with recombinant CVB3 virus at an MOI of 3 using titered stocks produced by transfection. Squares (■) represent CVB-MA, open squares (□) represent CVB-MA M1–10, triangles (▲) represent CVB3.1, circles (●) represent CVB-CA, and open circles (○) represent CVB-CA M1–10. CVB-MA and the M1–10 version, in which the HIV-1 matrix protein is stable in both for at least 10 passages, had similar growth dynamics to the parental virus (CVB3.1). Titers of the three viruses peaked at 8 h post-infection. The CVB-CA vectors had slower growth rates than the parental virus, taking 12–24 hours to reach peak titer, but eventually achieve a similar titer by end of assay.

