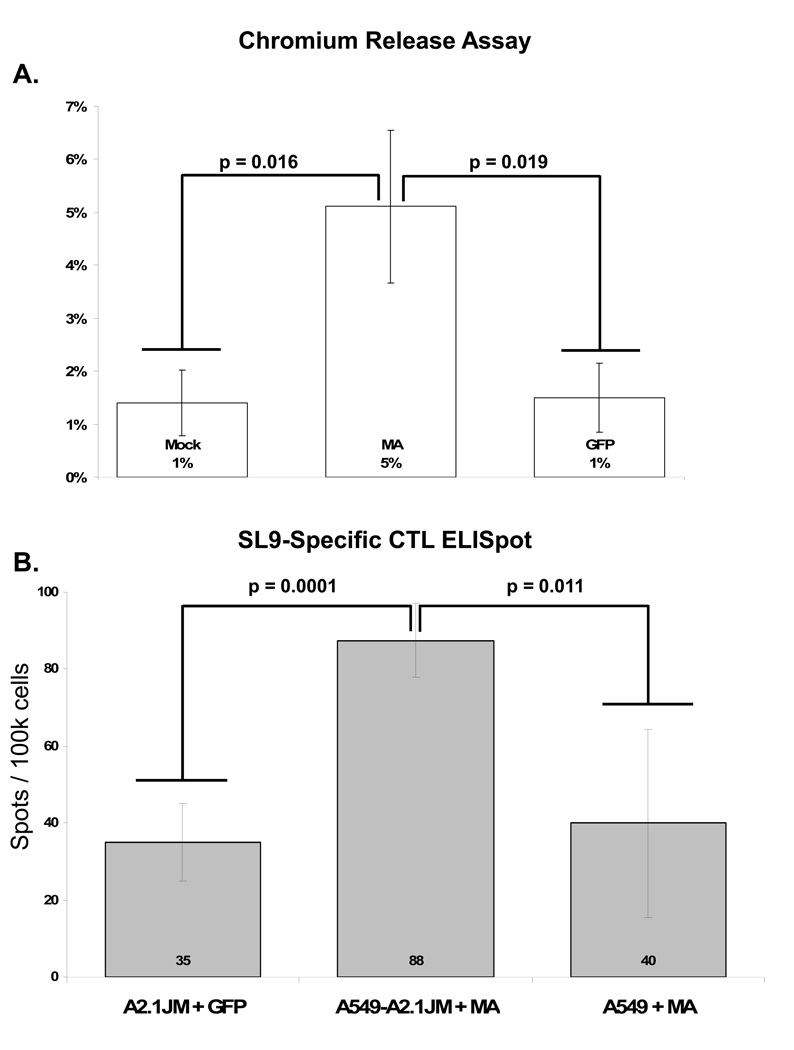
Figure 6. Antigen presentation by cells infected with CVB3 vectors.
(A) A549-A2.1JM cells were used as target cells for chromium release assays. Cells were either left uninfected (Mock) or infected at an MOI of 3 with CVB-MA, CVB-MA (M1–10), or CVB-EGFP vectors. At 10 hours post infection, cells were collected and incubated with a T cell clones specific to the SL9 epitope found in HIV-1 matrix protein. The graph shows percent specific lysis of uninfected cells, cells infected with vectors expressing either EGFP or MA, or cells infected with CVB-MA (M1–10) vector (Bars reflect mean and standard deviation from eight independent experiments). The specific lysis of control target cells labeled with SL9 peptide was 49% (standard deviation 9%)(not shown). (B) 104 cells of the same CTL clone were incubated 1 : 1 with target cells infected at an MOI of 10 using the above CVB3 vectors. A2.1JM + GFP represents HLA-A*0201 positive cells infected with the irrelevant CVB-GFP vector. A2.1JM + MA represents HLA-A*0201 cells infected with the CVB-MA vector. A549 + MA represents the parental cell line (which does not express HLA-A*0201) infected with the CVB-MA vector. All wells shown were done in quadruplicate. Numbers in graph represent mean number of spots per 100,000 cells; error bars indicate standard of deviation. This experiment is representative of three independent experiments. Positive controls using target cells labeled with SL9 peptide showed too many spots to count (not shown).

