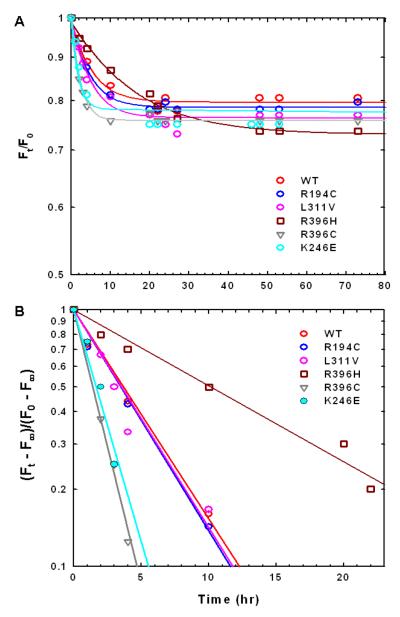
FIGURE 9.
(A) Time dependent fluorescence change at 37 °C (Ft/F0 vs time) measured at 337 nm of WT and mutant enzymes. (B) The plots of ln [(Ft — F∞) /(F0 — F∞)] vs time and the slope of each plot yields the kFobs of each enzyme. The F0 and Ft, are the fluorescence intensities at time 0 and time t, respectively. The F∞ is the limiting fluorescence intensity of each enzyme.

