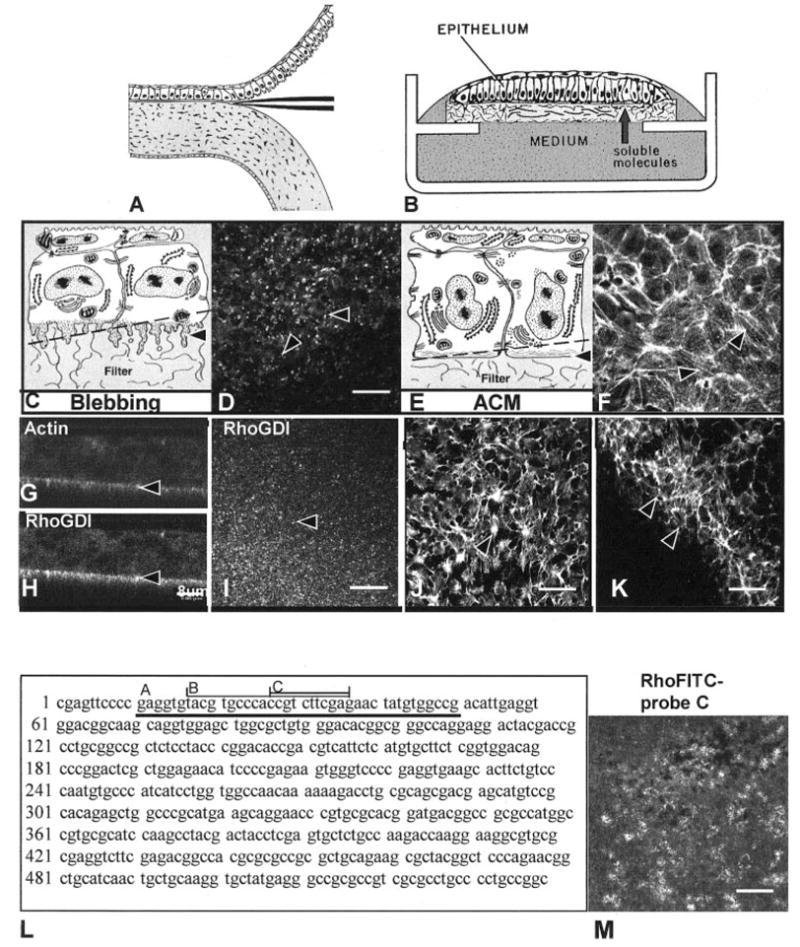
Figure 1.

Schematic drawing of isolation of corneal epithelium (A), culture of the cells (B), and confocal images (D, F–K), human Rho A sequence (L), antisense probes (L, A–C) and confocal image of FITC-labeled antisense oligonucleotide probe (M). Epithelia were isolated as a sheet of tissue (A), placed on a polycarbonate filter basal-side down, and cultured at the air–medium interface (B). Epithelia isolated without the basal lamina extended basal cellular processes termed blebs (C, arrowhead). The blebs contain F-actin, which appeared as punctate spots in single optical sections (D, arrowheads) taken through the basal area illustrated in the schematic drawing (C, dashed line). Immunohistochemical localization of RhoGDI demonstrated that this protein was enriched in the protruding blebs from tissues isolated without the basal lamina (H, I). Tissue cultured with soluble ECM molecules reorganized the basal actin into an ACM (E, arrowhead). The bundles of F-actin viewed in a single optical section from epithelia stimulated with COL for 2 hours (F, arrowheads) appeared to align from cell to cell, across the field. The epithelium stimulated with bombesin (J) or LPA (K) reformed the ACM after 30 minutes.10 The upper right corner (K) was in the optical section through the basal cell nuclei, and the individual cell size was visible in the honeycomb pattern of the lateral cell membrane actin distribution. Corneal epithelial tissues were cultured in control media, transfected with a 40- (L-A), 20- (L-B), or 10-mer (L-C) oligonucleotide directed against the 5′ region of human Rho mRNA (5–10 ng per 20 epithelia) for 24 hours in the presence of liposomes. The largest probe (L-A) was used first, and then the shorter probes were designed. A single optical section through the basal cells demonstrates that the oligonucleotide (FITC-labeled 10-mer) was evenly transfected throughout the tissue (M). Scale bar: (D, I–K, M) 20 μm; (G, H) 8 μm.
