
Fig. 3.
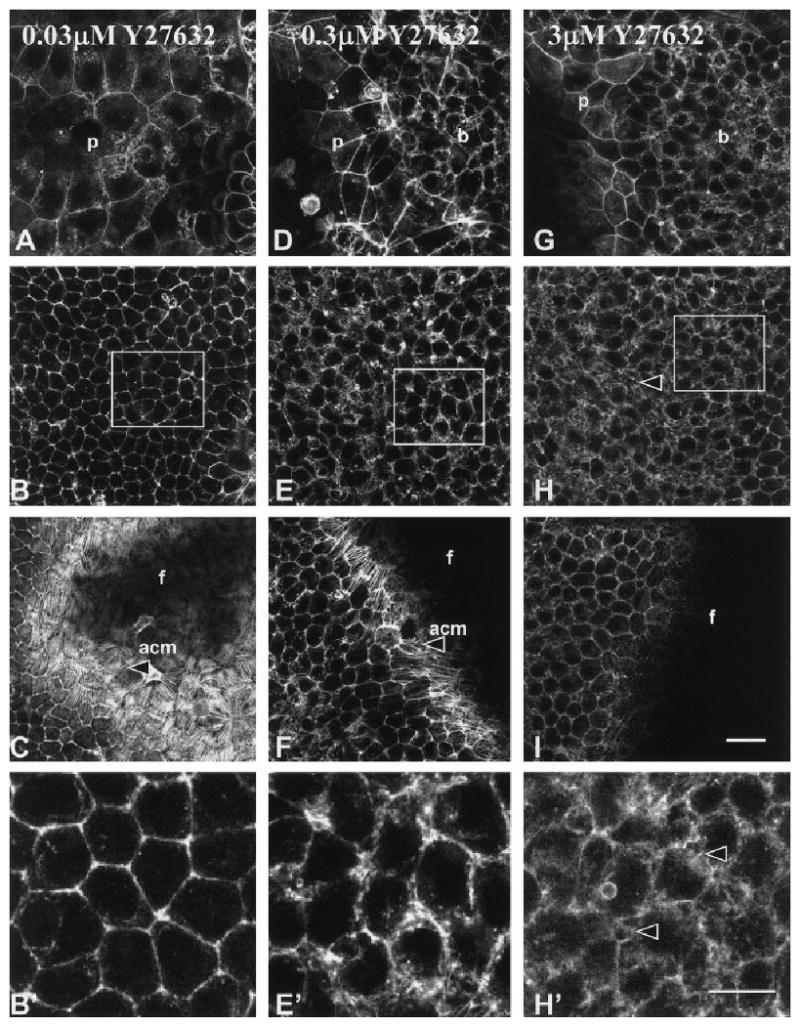
Single confocal optical sections through epithelia treated with Y27632 (0.03, 0.3, and 3 μM) stimulated with LPA and then stained with phalloidin. Three single optical sections (Fig. 1A, dashed lines) are shown from complete z-series for each treatment. A–I: The sections at the periderm-basal cell junction (A,D,G), central basal cells (B,E,H), and basal cell–filter interface (C,F,I) are shown to demonstrate the actin distribution throughout a representative epithelium. B′,E′,H′: Selected areas in B, E, and H (boxes) were enlarged. The actin in the periderm and cortical areas of basal cells had a normal distribution (A–C) and the cells reorganized an extensive actin cortical mat (acm, arrowhead) in the presence of the lowest concentration of Y27632 (0.03 μM). The periderm cell shape (D, p) and lateral cell actin distribution (E, E′) appeared altered in tissues treated with 0.3 μM Y27632, and the actin cortical mat were sparsely organized (F, arrowhead). Epithelia treated with 3 μM Y27632 had less polymerized actin in the cortical membrane areas (H, H′) and no actin cortical mat (I). In addition, the basal cell lateral membranes appeared to have bubbles or blebs (arrowheads, H and H′). f, filter; p, periderm; b, basal cells. Scale bar = 20 μm in I (applies to A–I), 10 μm in H′ (applies to B′,E′,H′).