
Fig. 5.
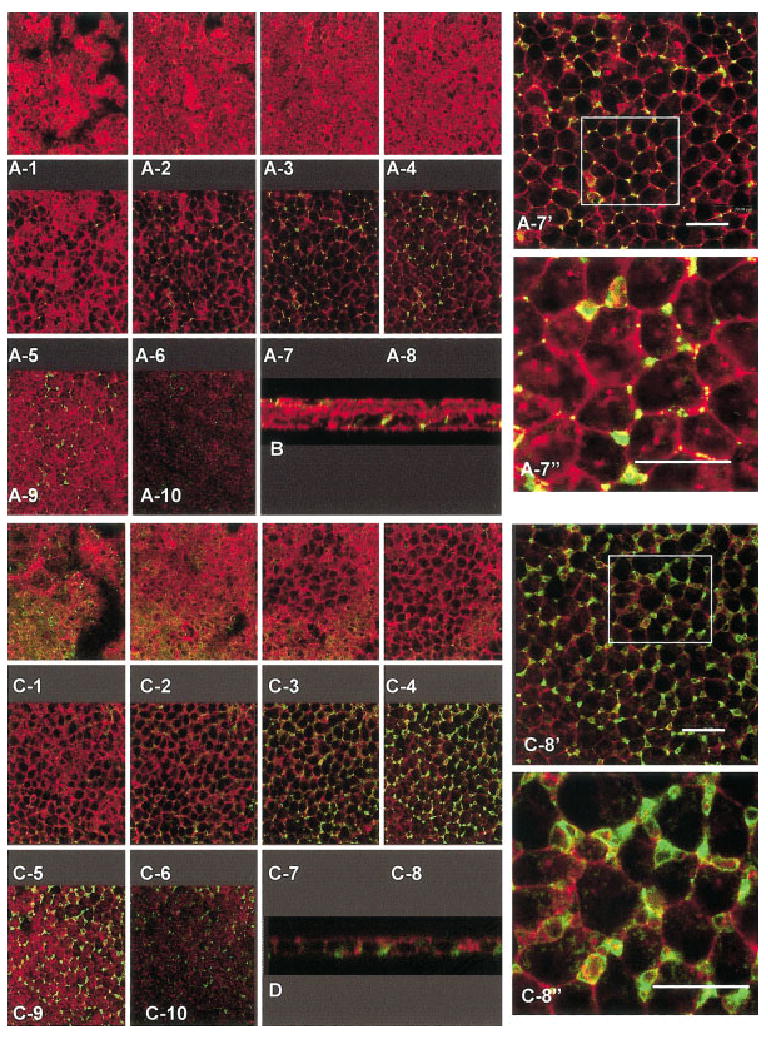
A–D: The complete z series through epithelium treated with 3 μM Y27632 + collagen (COL, A,B) or 10 μM Y27632 + COL (C,D) double labeled with annexin V (green) and phalloidin (red) demonstrates the total distribution of the exposed phosphatidylserine. The apical optical sections of the tissue treated with 3 μM Y27632 (A1–5) have little annexin V staining; however, the basal cells (A6–10) were positive for annexin V binding. Image A-7 was enlarged (A-7′) to demonstrate that the overall architecture of the tissue and distribution of annexin V. An additional area (box in A-7′) was enlarged again (A-7″) to view the distribution of actin and annexin V staining. The basal blebs below the plane of the basal cells (A-10, B) also contained annexin V staining. An xz image (cross-sectional view) also demonstrated that the distribution of annexin V staining (B) was in the basal lateral membranes. The actin cortical mat did not form in this epithelium (A-10). A complete z-series through an epithelium from the apical to the basal surface treated with 10 μM Y27632 had some annexin V staining in the apical regions of the tissue (C1–3), but the staining was more prominent in the basal lateral regions of the basal cells (C5–10). The region approximately 5 microns from the basal surface (C 8) appeared to contain the highest amount of annexin V binding and were shown at two higher magnifications (C 8′ and 8″). Cross-sectional analysis of different epithelia with the same exposure to Y27632 also demonstrated that the annexin V staining was more extensive in basal cells of epithelium exposed to 10 μM Y27632 (D). Scale bars = 20 μm.