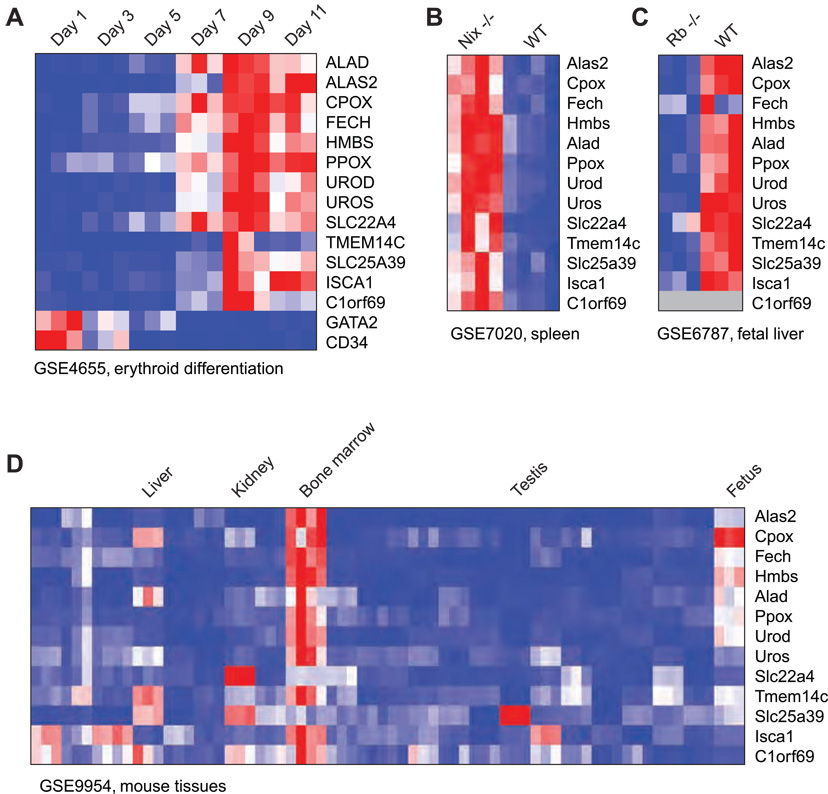
Figure 2.
Microarray datasets where the heme biosynthetic pathway is regulated. (A) Time-series gene expression of heme biosynthesis enzymes and five selected candidates (see text) during erythroid differentiation. (B) Gene expression in Nix−/− and wild-type (WT) mouse spleen. (C) Gene expression in Rb−/− and wild-type (WT) mouse fetal liver. (D) Gene expression in a panel of mouse tissues. Red color indicates high expression; blue, low expression; gray color, missing values. GSE, NCBI Gene Expression Omnibus accession number.

