Fig. 1.
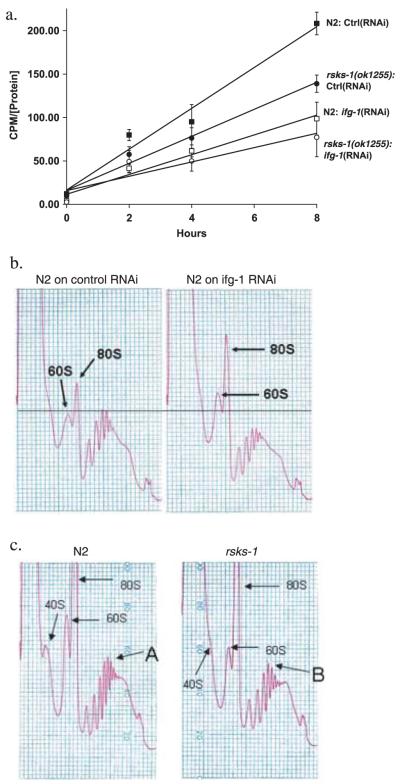
Inhibition of either rsks-1 or ifg-1 reduces the rate of protein translation. (a) Reduction in rates of protein synthesis measured by 35S-methionine incorporation upon inhibition of ifg-1and rsks-1. Age-matched adults were placed in 35S-methionine-labelled OP50 for 0, 2, 4, and 8 h. Radioactivity was measured in the TCA precipitated protein extract and standardized for protein concentration. Protein synthesis rate was evaluated by measuring the slope of the curves during incorporation. The following slopes were observed: N2 on L4440 (control RNAi), 23.5 (cpms (counts per minute) μg-1) h; rsks-1(ok1255) on L4440 (control RNAi), 15.5 (cpms μg-1) h; N2 on ifg-1(RNAi), 11.4 (cpms μg-1) h; rsks-1(ok1255) on ifg-1(RNAi), 8.3 (cpms μg-1) h. Each data point represents the mean of three biological replicates. Similar results were obtained in two separate experiments. (b,c) Polysomal profiles were generated by measuring absorbance profiles at 260 nm of worm extracts separated on 10-50% sucrose gradients. (b) The N2 strain on control RNAi and ifg-1(RNAi) and from (c) N2 and rsks-1(ok1255). 40S, 60S, and 80S labels show the position of ribosomal subunits and whole ribosomes. There was an increase in the 60S and the 80S peaks upon inhibition of ifg-1 accompanied by a decrease in the polysomal peaks suggesting a significant reduction in ribosomes that were involved in mRNA translation but an increase in free ribosomes (b). Maximum absorbance in N2 was detected in the sixth ribosome peak (A) vs. the fifth (B) in the rsks-1(ok1255) (c). Results are representative of three experiments performed.

