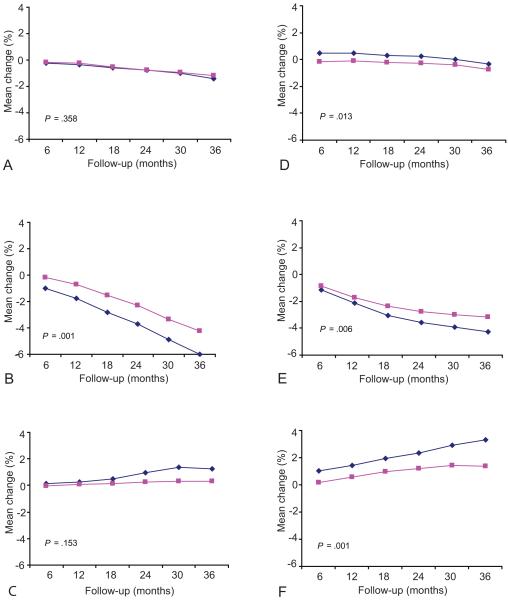
Figure 3.
Modeled mean percentage change from baseline across 36 months by age group in femoral neck bone mineral density for (A) oral contraception, (B) depot medroxyprogesterone acetate, and (C) nonhormonal contraception; and spine bone mineral density for (D) oral contraception, (E) depot medroxyprogesterone acetate, and (F) nonhormonal contraception. Blue diamonds = 16–24 year olds; pink squares = 25–33 year olds. P values indicate the difference in coefficient between the two age groups derived from the method-specific mixed-model regression analyses.

