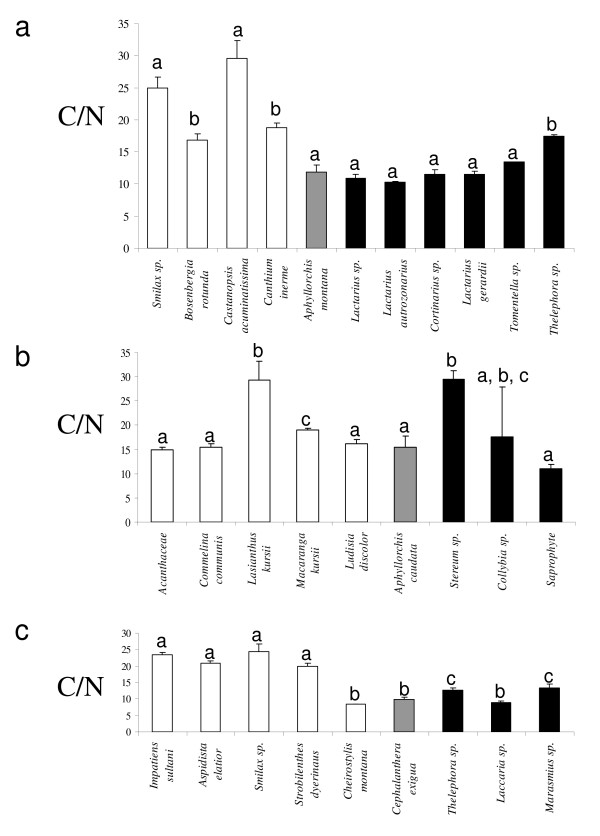
Figure 9.
C/N ratio values of the three mycoheterotrophic orchids and other green orchids C/N ratio values of green plants, (white bars), mycoheterotrophic plants (grey bars) and fungi (black bars) from three sites: Doi Suthep #2 ((a), including A. montana and various ectomycorrhizal (ECM) fungi), Doi Suthep #3 ((b), including A. caudata, various saprobic fungi), Doi Pee Pan Nam ((c), including C. exigua, two ECM fungi and a saprobic Marasmius). Letters denote significant differences between species, according to pairwise Mann-Whitney tests (P < 0.01 at minimum); bars indicate the standard deviation.

