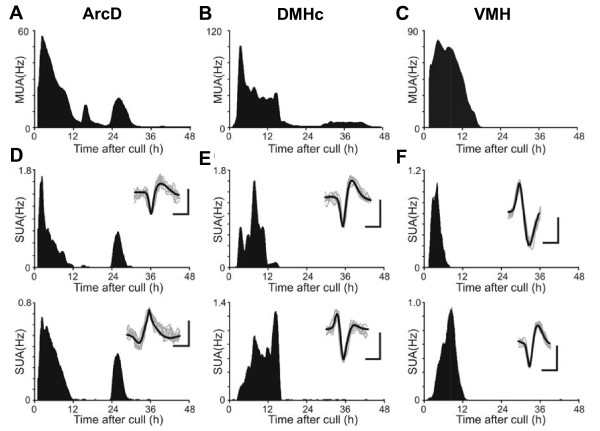
Figure 3.
Temporal patterns of electrical activity in mediobasal hypothalamic nuclei. Mediobasal hypothalamic nuclei exhibited a continuum of temporal profiles in electrical activity. Recordings of ArcD exhibited robust multiunit (MUA; A) and single unit activity (SUA; D) rhythms. MUA rhythms recorded from the DMHc (B) damped more rapidly than in the ArcD, while SUA profiles typically exhibited a single peak (E). In contrast, the ventromedial hypothalamus rarely sustained detectable MUA (C) or SUA (F) for longer than 18 h. Inset traces in D-F indicate the average spike waveforms for each cell (thick black line) and 8 consecutive matching spikes (thin grey lines); scale bars represent 15 μV (vertical) and 1 ms (horizontal). All figures are representative examples from single slices of MBH. Abbreviations as in text.

