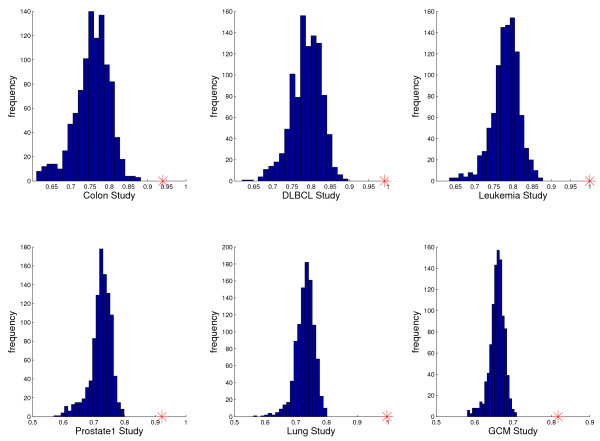
Figure 3.
Significance of top-scoring gene triples in different studies. The score histograms for the top-scoring gene triple for one thousand random permutations of the class labels. Top row: Colon, DLBCL, Prostate1 data. Bottom row: Leukemia, Lung, GCM data. In each case, the red cross marks the top score on the real data.

