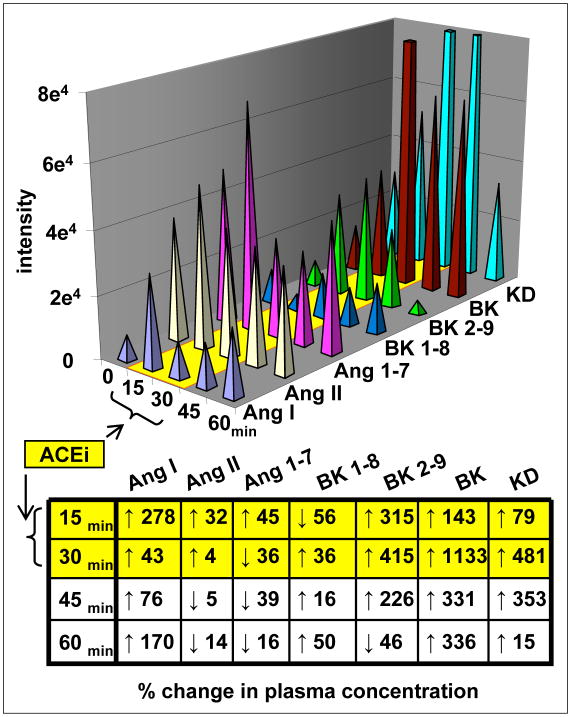
Figure 7. Vasoactive peptides in plasma before, during and after ACEi infusion.
The relative signal intensity for 7 structurally and/or functionally related hormones was determined in an anesthetized rat. Blood samples (<100 μl) were drawn at 15 min intervals. Endogenous peptides were concentrated 10 fold and 2 μl was injected on column. Changes over time for each peptide are expressed as a percentage of control in the table.

