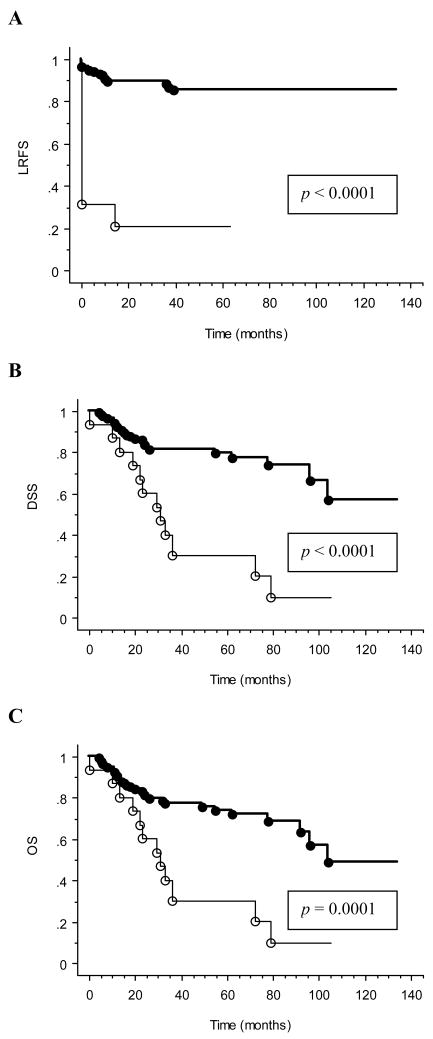
Figure 3. Univariate analysis of the interaction between presence of gross disease and survival outcomes.
Kaplan-Meier curves are shown with p-values determined by log-rank test for (A) LRFS, (B) DSS, and (C) OS. Absence of gross disease at the time of radiation treatment is indicated by heavy solid line (), while presence of gross disease is indicated by thin solid line (). Circles designate events.

