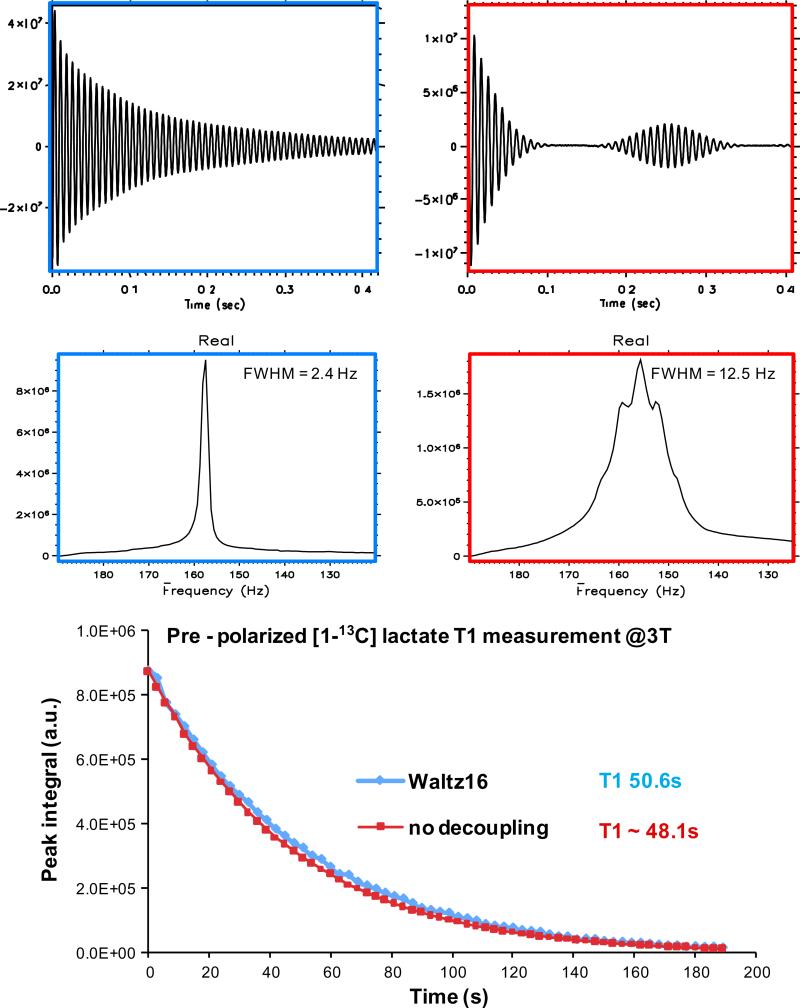
Fig. 3.
In vitro T1 measurement of pre-polarized [1-13C] lactate at 3 T. Representative FIDs and spectra from both the 1H decoupled experiments (upper and middle left) and the experiments without decoupling are shown (upper and middle right). Signal decay curve from the representative data are plotted (lower plot), the two curves are normalized by the first time point of each experiment.

