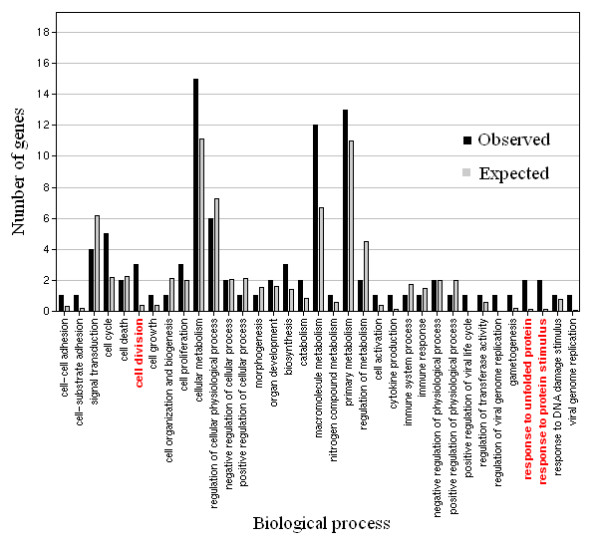
Figure 2.

Gene enrichment analysis for cell line exposed to EGT pulses. Expected – number of genes expected to be differentially expressed. Observed – number of genes differentially expressed. In red are GO biological functions significantly enriched in the cell line exposed to EGT pulses.
