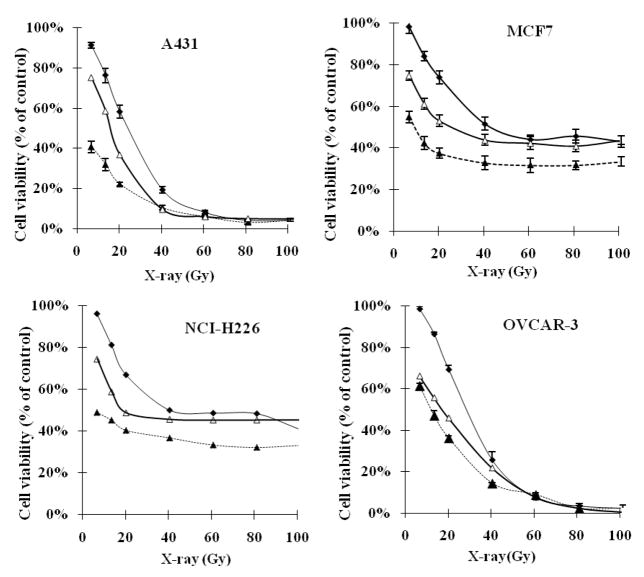
Figure 1.
The effect of 2-AAPA or BSO on the dose response curve of X-ray with A431, MCF7, NCI-H226, and OVCAR-3 cell lines (-◆-: radiation alone; -△-: BSO + radiation; -▲-: 2-AAPA + radiation;. Cells pretreated with 2-AAPA (2h) or BSO (50 μM, 24h) followed by X-ray irradiation as described in the Materials and Methods. The data are presented as percentage of the control where cells were treated with no radiation, no 2-AAPA and no BSO. The cell viability for the control was > 95%. The data are expressed as the means ± S.D. of three independent experiments.

