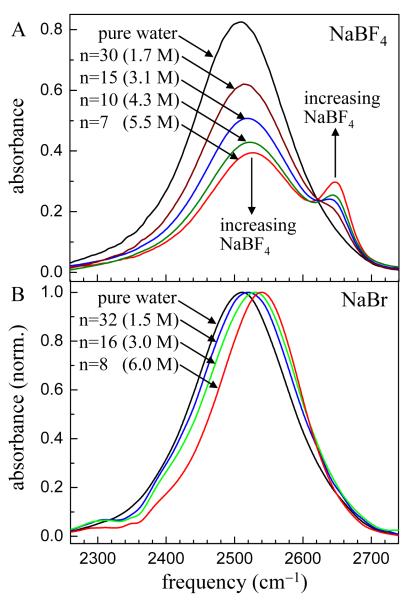
Figure 1.
FT-IR spectra of the OD stretching mode of dilute HOD in H2O as a function of salt concentration. A. NaBF4 spectra. The OD hydroxyl bound to the anion (small peak at high frequency) and the OD bound to another water’s oxygen are spectrally resolved. B. NaBr spectra. The water-anion and water-water bands are not resolved.

