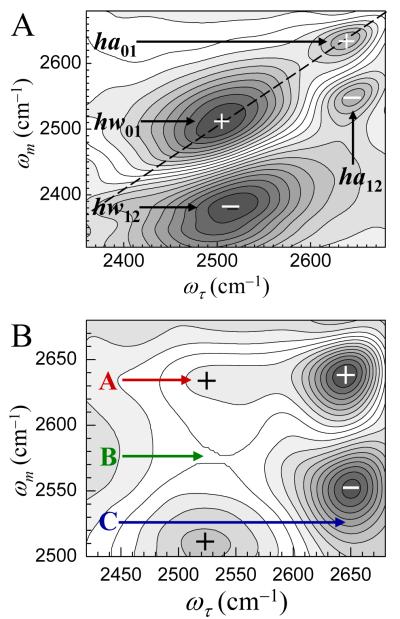
Figure 3.
2D IR vibrational echo spectra of the 5.5 M (n = 7) solution of NaBF4 at Tw = 200 fs (A) and Tw = 4 ps (B). Positive going peaks are marked by + and negative going peaks are marked by -. By 4 ps additional peaks at locations labeled A, B, and C have grown in because of chemical exchange (see text).

