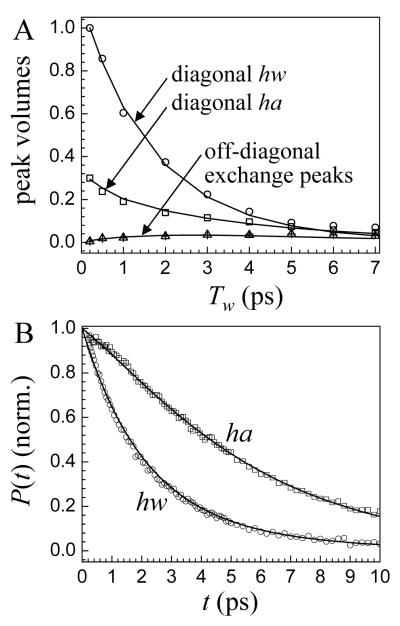
Figure 4.
A. Peak volumes as a function of Tw of the diagonal and chemical exchange peaks. The solid curves are the result of fitting to the chemical exchange kinetic model. B. Vibrational population decays for OD hydroxyl bound to an anion (ha) and for the OD bound to another water oxygen (hw). The solid curves are the result of simultaneously fitting the population decays and the peak volumes shown in A to the chemical exchange kinetic model.

