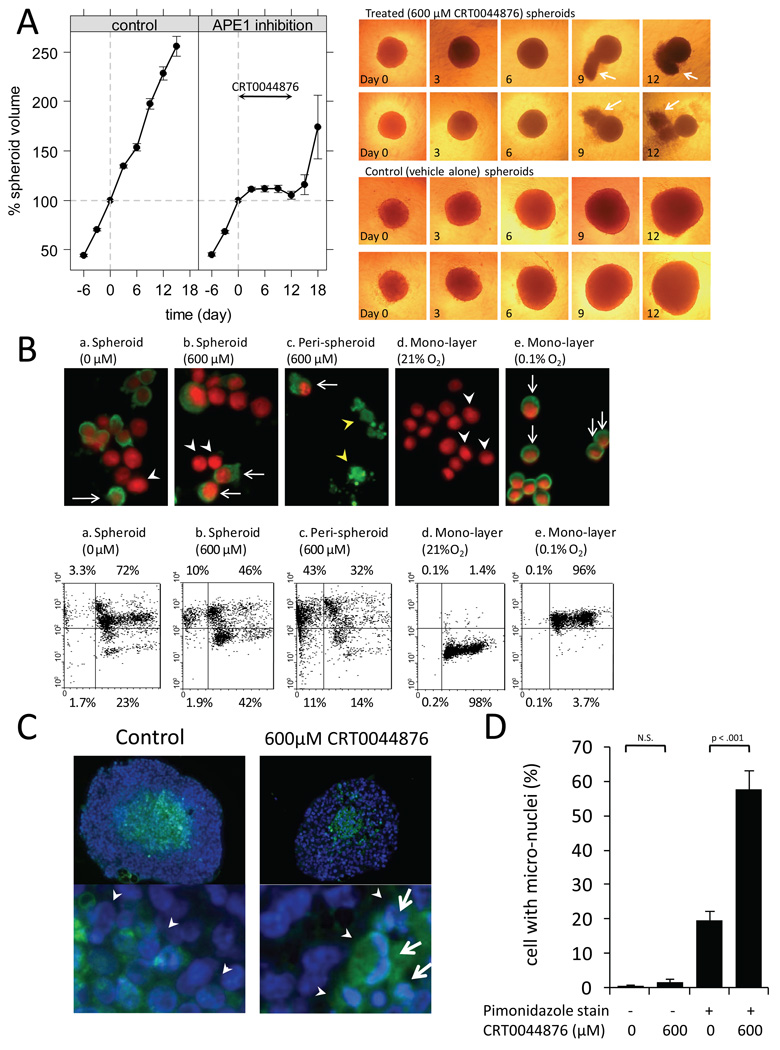
Fig. 3.
(A) Growth of HCT116 multicellular spheroids treated with 0µM or 600µM CRT0044876 at pHe7.4 for 12 days (mean±sem of greater than 100 spheroids in each group from the 5 independent experiments). Representative images of the spheroids by phase-contrast microscopy (×40) are also shown. Note the debris-like material adjacent to the CRT0044876-treated spheroids (white arrows) at days 9 and 12. (B) Following one-week treatment with 0µM or 600µM CRT0044876, spheroids (subpanel a, b) and peri-spheroid stranding (debris-like materials shown in the panel A) (subpanel c) were separately collected. No detectable materials were recovered as a peri-spheroid stranding from the spheroids treated with 0µM CRT0044876. The upper panels are representative images (×400) of immunocytochemical staining for pimonidazole (green). Nuclei were counterstained with propidium iodide (red). (white arrows: pimonidazole-positive cells, white arrow heads: pimonidazole-negative cells, yellow arrow heads: pimonidazole-positive cellular remnants). The lower panels show flow cytometric analysis of the same samples (x-axis: DNA contents, y-axis: a log scale of pimonidazole stain). (C) Immunohistochemical analyses from paraffin-embedded sections of the HCT116 spheroids following a 4-day treatment with CRT0044876 (×200) (green: pimonidazole, blue: Hoechst33342). Arrow heads indicate an interface between hypoxic and normoxic regions. 600µM CRT0044876 resulted in micronuclei (white arrow) in the central hypoxic regions but not in the peripheral normoxic regions. (D) The frequency of micronuclei was quantitated in the 5 pairs of spheroid sections with 0 or 600µM CRT0044876 treatment (Bar: mean±sem).

