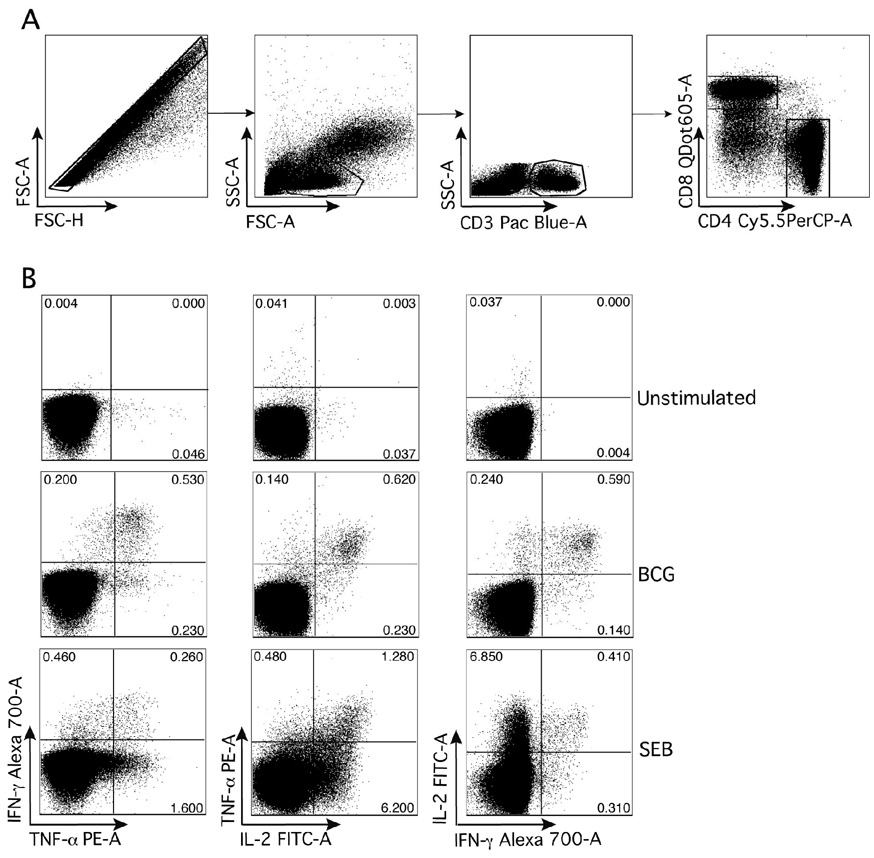
Figure 2. Gating strategy used to analyze CD4 and CD8 T cell cytokine responses.
Whole blood was incubated with BCG to complete a flow cytometric intracellular cytokine assay, as described in the Methods.
(A) Doublet cells were excluded by gating on Forward Scatter–Area (FSC-A) against Forward Scatter-Height (FSC-H), and lymphocytes were then selected in a FSC-A against Side Scatter-Area (SSC-A) dots plot. T cells were selected by gating on CD3+ events, which were further differentiated into CD4 and CD8 T cells. (B) Representative dot plots of cytokine co-expression patterns in CD4 T cells from unstimulated, BCG and SEB-stimulated conditions.

