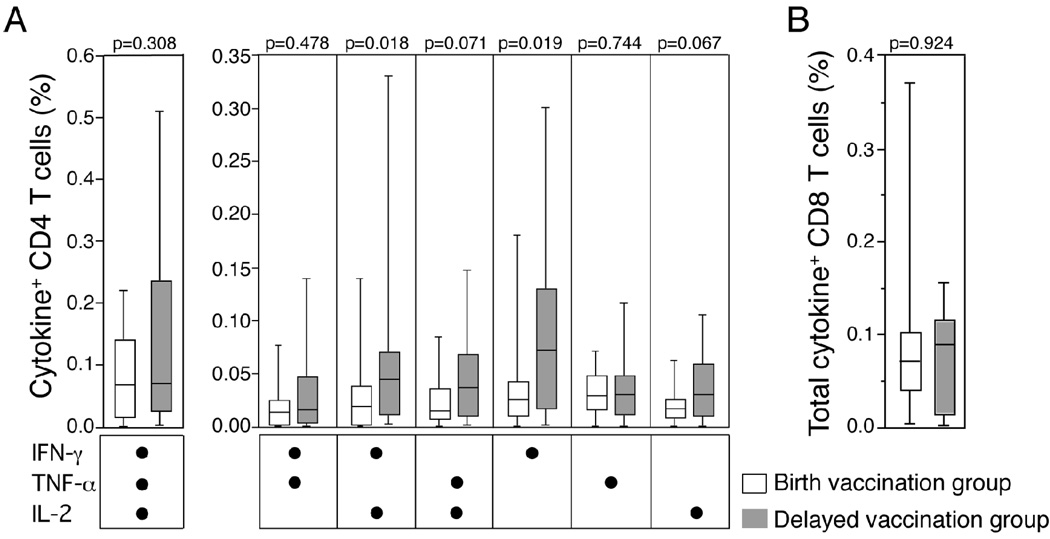
Figure 4. BCG-specific T cell responses 10 weeks post-vaccination, in infants who received BCG at birth and those who received BCG at 10 weeks of age.
(A) Frequencies of BCG-specific cytokine expressing CD4 T cells are shown, as detected by the whole blood intracellular cytokine assay. (B) Frequencies of all expressing CD8 T cells, evaluated together, after incubation of whole blood with BCG. The median is represented by the horizontal line, the interquartile range by the box, and the range by the whiskers. The Mann-Whitney U test was used to calculate p values of differences between the 2 groups.

